Adding shadows to bar and column charts, Adjusting the opacity of bar and column charts, Area charts and line charts – Apple Pages '08 User Manual
Page 217
Chapter 10
Using Charts
217
You can also move the pointer near a bar edge until it becomes a double-headed
arrow, and then drag to make the bars thicker or thinner.
Adding Shadows to Bar and Column Charts
You can add shadows to each bar in the chart or to each group of bars.
If you want to add shadows to individual bars, it’s a good idea to separate them first.
See “Adjusting Spacing of Bar and Column Charts” on page 216 for instructions.
To add shadows:
1
Select the chart.
2
Click Inspector in the toolbar, click Chart Inspector, and then click Series.
3
To add shadows to individual bars, choose Individual from the Shadow pop-up menu.
To add shadows to each group of bars, choose Group from the Shadow pop-up menu.
4
To set shadow attributes, use the Graphic Inspector. See “Adding Shadows” on
page 144 for instructions.
Adjusting the Opacity of Bar and Column Charts
You can change the opacity of the chart and individual chart elements, such as the
legend. See “Adjusting Opacity” on page 146 for more information.
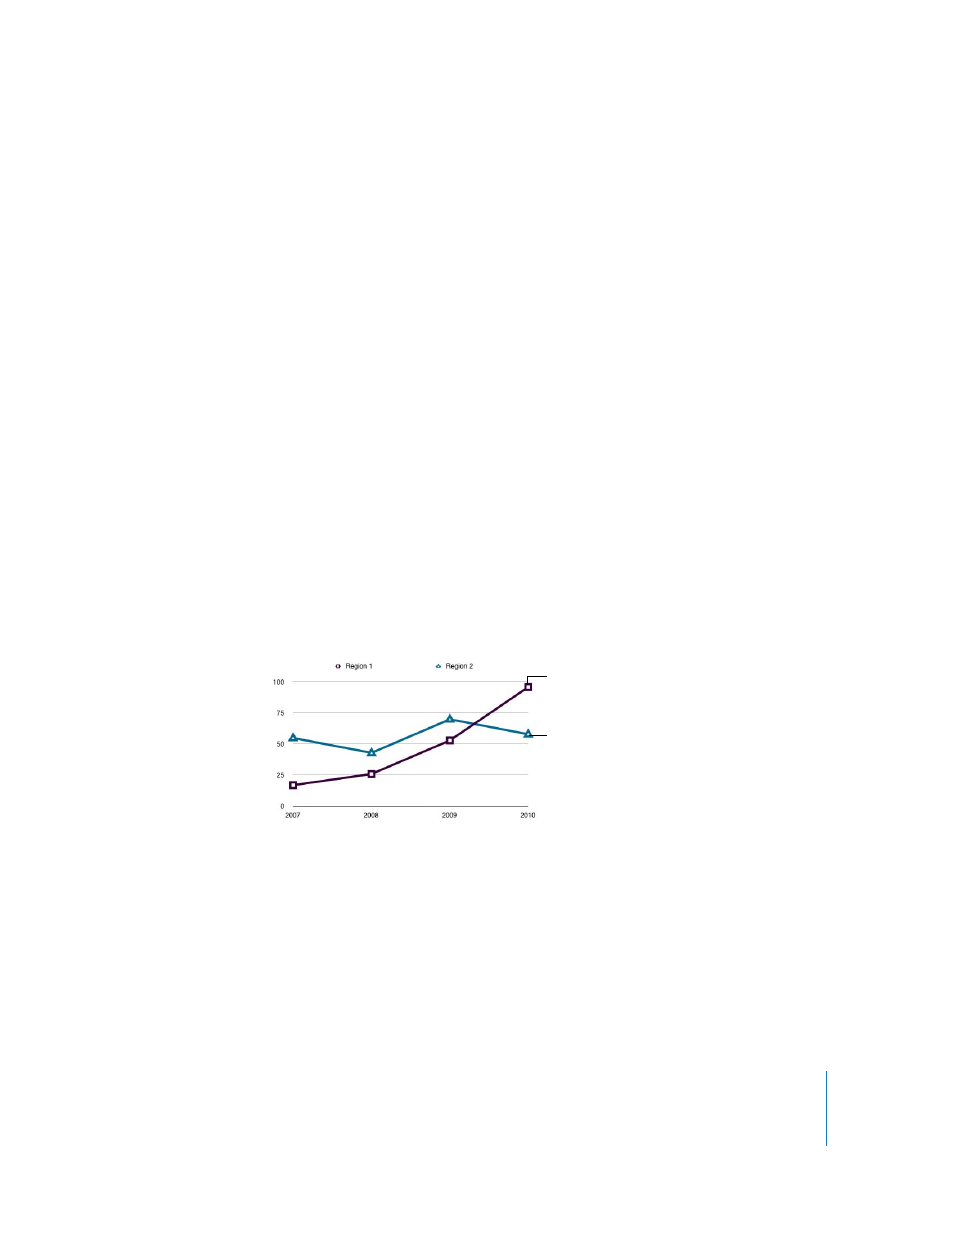
Area Charts and Line Charts
In area and line charts, you can use symbols (circles, triangles, squares, and diamonds)
to represent data points.
The data points in this
series are represented
by squares.
The data points in this
series are represented
by triangles.