Rotating charts, Adding labels and axis markings, Showing axes and borders – Apple Pages '08 User Manual
Page 209
Chapter 10
Using Charts
209
Rotating Charts
There are several techniques for rotating 2D charts. You can’t rotate (or flip) 3D charts. If
a 3D chart is grouped with 2D charts, you can rotate the group, but only the 2D charts
in the group will rotate.
Here are ways to rotate 2D charts:
m
Select the chart, hold down the Command key, move the pointer toward an active
selection handle until it changes to a curved, double-headed arrow, and then drag a
selection handle.
m
To rotate a chart in 45-degree increments, press the Shift and Command keys while
dragging a selection handle.
m
Click Inspector in the toolbar, click the Metrics Inspector button, and then drag the
Rotate wheel or use the Angle controls to set the angle of the chart.
Pie charts can also be rotated using the Chart Inspector (see “Rotating 2D Pie Charts”
on page 216).
Adding Labels and Axis Markings
Use the Axis pane in the Chart Inspector to format the grid and general look of chart
axes.
Most charts have two axes, an X-axis and a Y-axis. Depending on the type of chart, data
points are plotted on one of the axes and data sets are grouped on the other axis. The
data point axis is called the value axis, and the data set axis is called the category axis.
Showing Axes and Borders
You can show any or all of these elements of a chart: the X-axis, the Y-axis, and chart
borders.
To show axes and borders:
1
Select a chart.
2
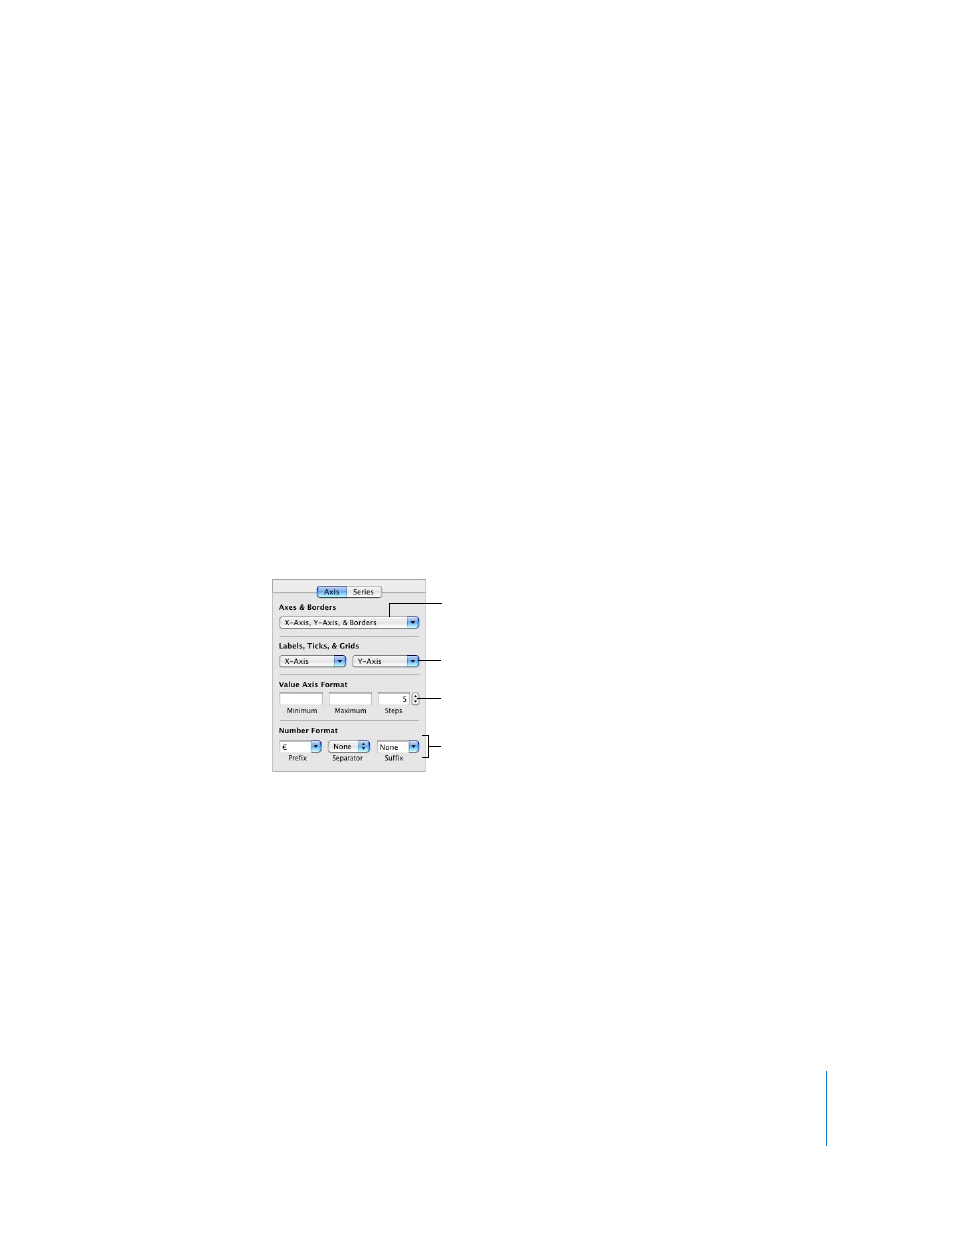
Click Inspector in the toolbar, click the Chart Inspector button, and then click Axis.
Set attributes of labels, tick
marks, and more.
Select units for values in
the chart.
Show or hide axes and chart
borders (2D charts only).
Set the range of values that
appear on the chart grid.