Display manipulation, Figure 114 waveform data display, Isplay – Teledyne LeCroy TA700_800_850 User Manual User Manual
Page 143: Anipulation
Display Manipulation
Catalyst Enterprises, Inc.
129
Display Manipulation
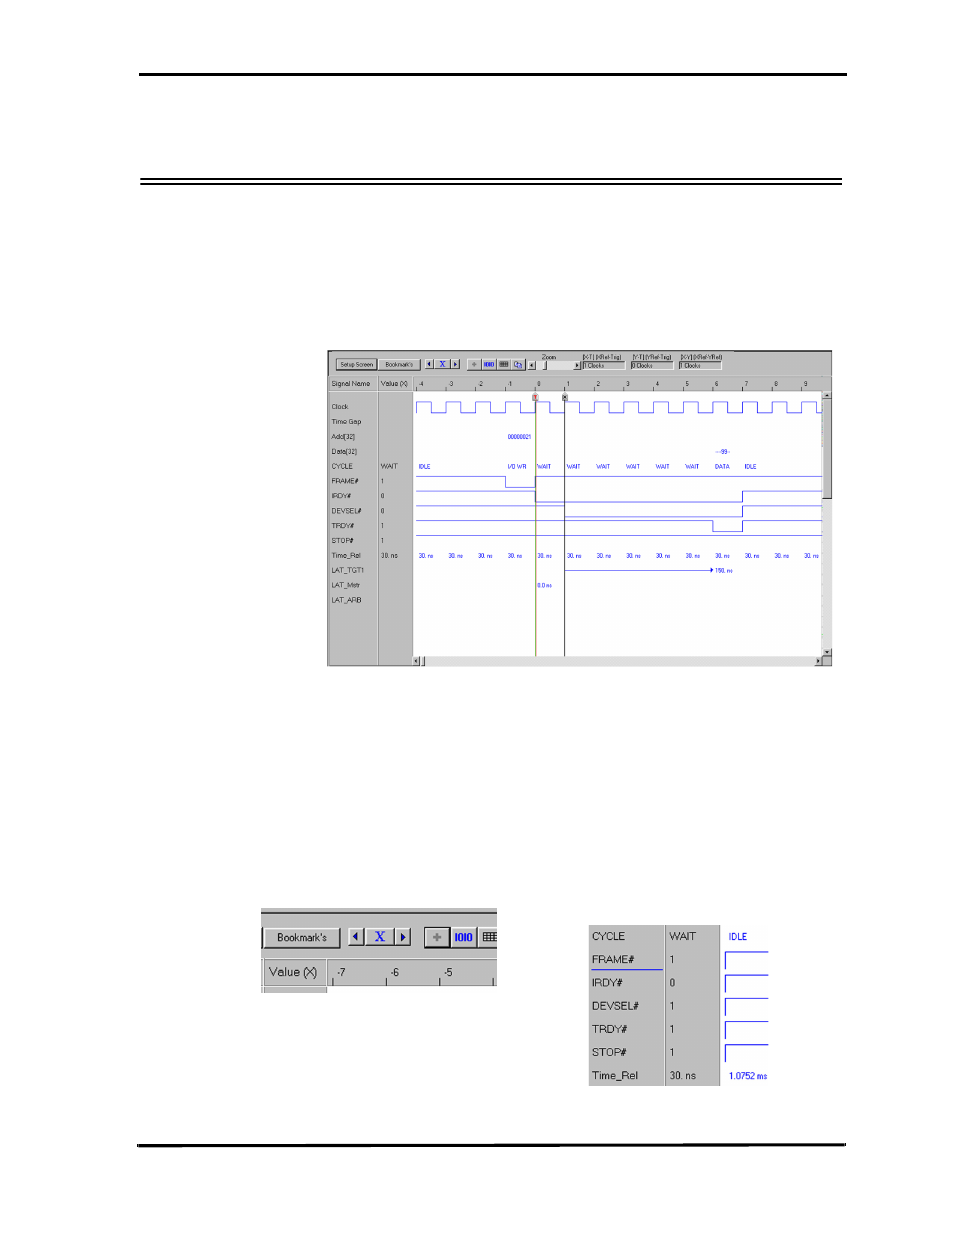
Captured data may be displayed in either a waveform Figure 114, a list window as
shown in Figure 115 or both simultaneously as shown in Figure 116. To enhance
viewing the data you may add or delete signals for viewing, use cursors to measure
timing differences and zoom in and out around the X and Y cursors to analyze the
captured events.
Figure 114 Waveform Data Display
You may rearrange the displayed signal order by selecting the signal name in the
display with the left mouse button and then dragging it to a new location.
Signal Level Display
A convenient numeric signal level readout appears next to each signal
name. The level indicated is at the active cursor position. Clicking on the
cursor select button on the Data Display menu bar toggles the numeric
readout to match the cursor selected. Clicking the + button enables this
feature.
- 6Zi Rackmount (12 pages)
- HDO Oscilloscope Rackmount (14 pages)
- LSIB-1 Host Interfaces (44 pages)
- OC1021 Oscilloscope Cart (9 pages)
- OC1024 Oscilloscope Cart (10 pages)
- OC910 Oscilloscope Cart (2 pages)
- TTL-AUX-OUT (1 page)
- WaveJet Rackmount (1 page)
- Zi Oscilloscope Rackmount (12 pages)
- USB2-GPIB (12 pages)
- WM8Zi-2X80GS (2 pages)
- WR6ZI-8CH-SYNCH (6 pages)
- Zi Oscilloscope Synchronization ProBus Module (Zi-8CH-SYNCH) (16 pages)
- LogicStudio (42 pages)
- WaveSurfer MXs-B Getting Started Manual (126 pages)
- WaveSurfer MXs-B Quick Reference Guide (16 pages)
- X-STREAM OSCILLOSCOPES Remote Control (305 pages)
- WS-GPIB (12 pages)
- PXA125 (219 pages)
- PXD Series (42 pages)
- PXD222 (38 pages)
- Oscilloscope System Recovery (8 pages)
- LabMaster 9Zi-A (264 pages)
- LabMaster 10Zi Rackmount (8 pages)
- LabMaster 10Zi Getting Started Manual (236 pages)
- LabMaster 10Zi Operators Manual (198 pages)
- WaveAce 1000_2000 (108 pages)
- WaveAce 1000_2000 Remote Control (92 pages)
- WaveRunner Xi-A Quick Reference Guide (16 pages)
- WaveRunner XI SERIES Operator’s Manual (233 pages)
- WaveMaster Automation Command (667 pages)
- WaveMaster 8 Zi_Zi-A (190 pages)
- WaveMaster 8000A (46 pages)
- WavePro 7 Zi_Zi-A (188 pages)
- WaveExpert series Automation Manual (285 pages)
- WaveExpert 9000_NRO9000_SDA100G Getting Started Manual (50 pages)
- WaveExpert 100H Operators Manual (348 pages)
- WaveRunner Automation Command (460 pages)
- WaveRunner Xi-A Getting Started Manual (128 pages)
- WaveRunner 6 Zi and 12-Bit HRO Getting Started Manual (198 pages)
- WaveRunner 6 Zi Quick Reference Guide (20 pages)
- WaveRunner 6 Zi-ExtRef-IN_OUT (2 pages)
- WaveSurfer Automation Command (226 pages)
- HDO 4000 Getting Started Guide (48 pages)
- HDO Removable Hard Drive (2 pages)