Retrotec USACE User Manual
Page 86

64 ENERGY & PROCESS ASSESSMENT PROTOCOL
A selection or grouping of measured values/variables by certain variables
is called a “fi lter” in the context of this chapter. An example is the selection of
all measured values above a certain outdoor air temperature. Therefore, the
behavior of the system under selected conditions can be studied with a fi lter.
Grouping the data means that the data is divided up (grouped or split) by a
certain variable (e.g., weekday and weekend): therefore, it is possible to com-
pare different operational modes.
For samples for visualizations for intelligent monitoring see Appendix J.
7.5.3 Interpretation of Monitored Data 2: Rule-Based Monitoring
Independent from its depth, each energy assessment will result in a better un-
derstanding of the behavior of the building and its technical systems. This can
be used to formulate rules on the expected behavior. Such rules include
Leakage control of water counter
■
Control of maximum or minimum temperatures
■
Control of electrical power of selected consumers
■
Time dependent average consumption
■
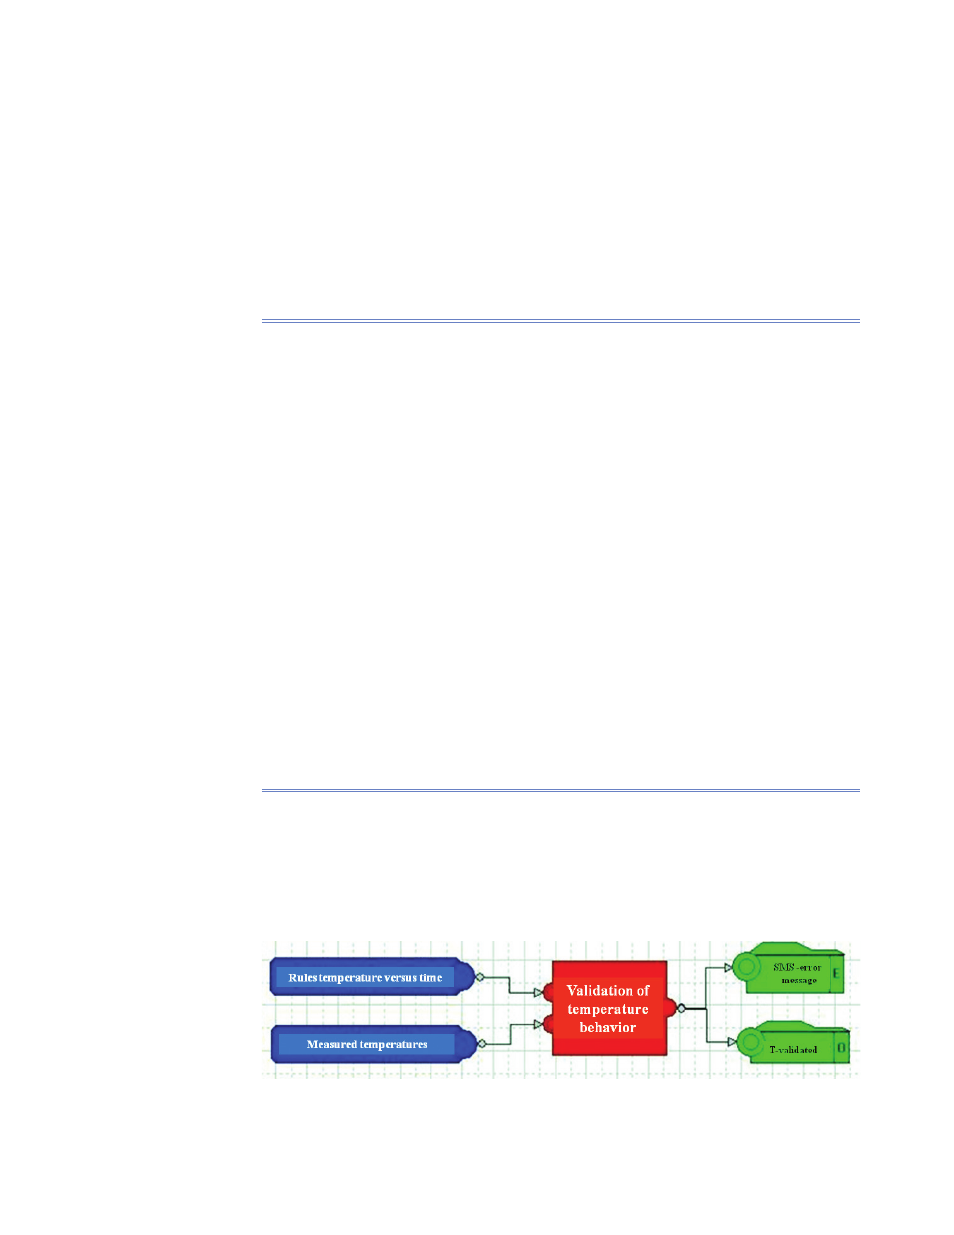
Differences between measured values and the rules can result in various
actions. They include
E-mail or short message service (SMS) to maintenance
■
Visualization for control
■
Activation of fault detection and diagnosis methods
■
For samples of rule-based monitoring see “Samples of Use of Intelligent
Monitoring” in Appendix N.
7.5.4 Interpretation of Monitored Data 3:
Model-Based Monitoring
If detailed models are available, we can derive from the Level II and Level
III analyses more stringent rules for system behavior. Usually the calculation
results are available in the form of a time series. This is similar to the measured
data; therefore, one is able to compare both measured and calculated data to
draw conclusions and to initiate actions (Figure 20).
Figure 20. Measured and calculated consumption data and reactions.
