Retrotec USACE User Manual
Page 441

Appendix N N11
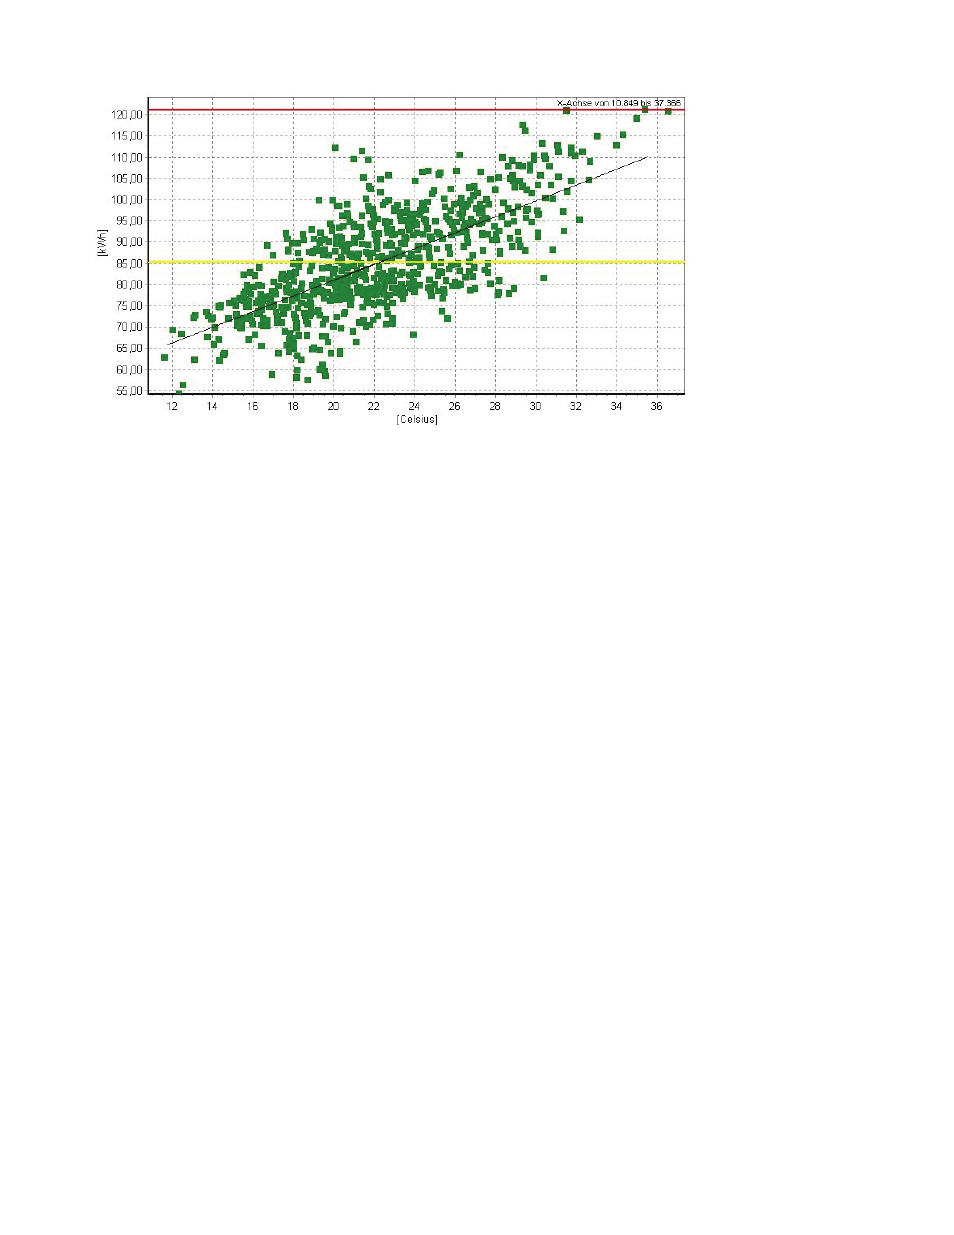
Figure N9. Energy signatures of chiller power consumption – hourly values for one month in
relation to free air temperature (X axis) with linear regression (black line) and average value
(yellow line).
With more advanced algorithms it becomes possible to fi lter out erroneous
data and group the remaining data according to certain criteria like work day
and holiday. This was done in Figure N10 for daily data of energy and water
consumption in one of the Building EQ case study buildings.
