Retrotec USACE User Manual
Page 440

N10 ENERGY & PROCESS ASSESSMENT PROTOCOL
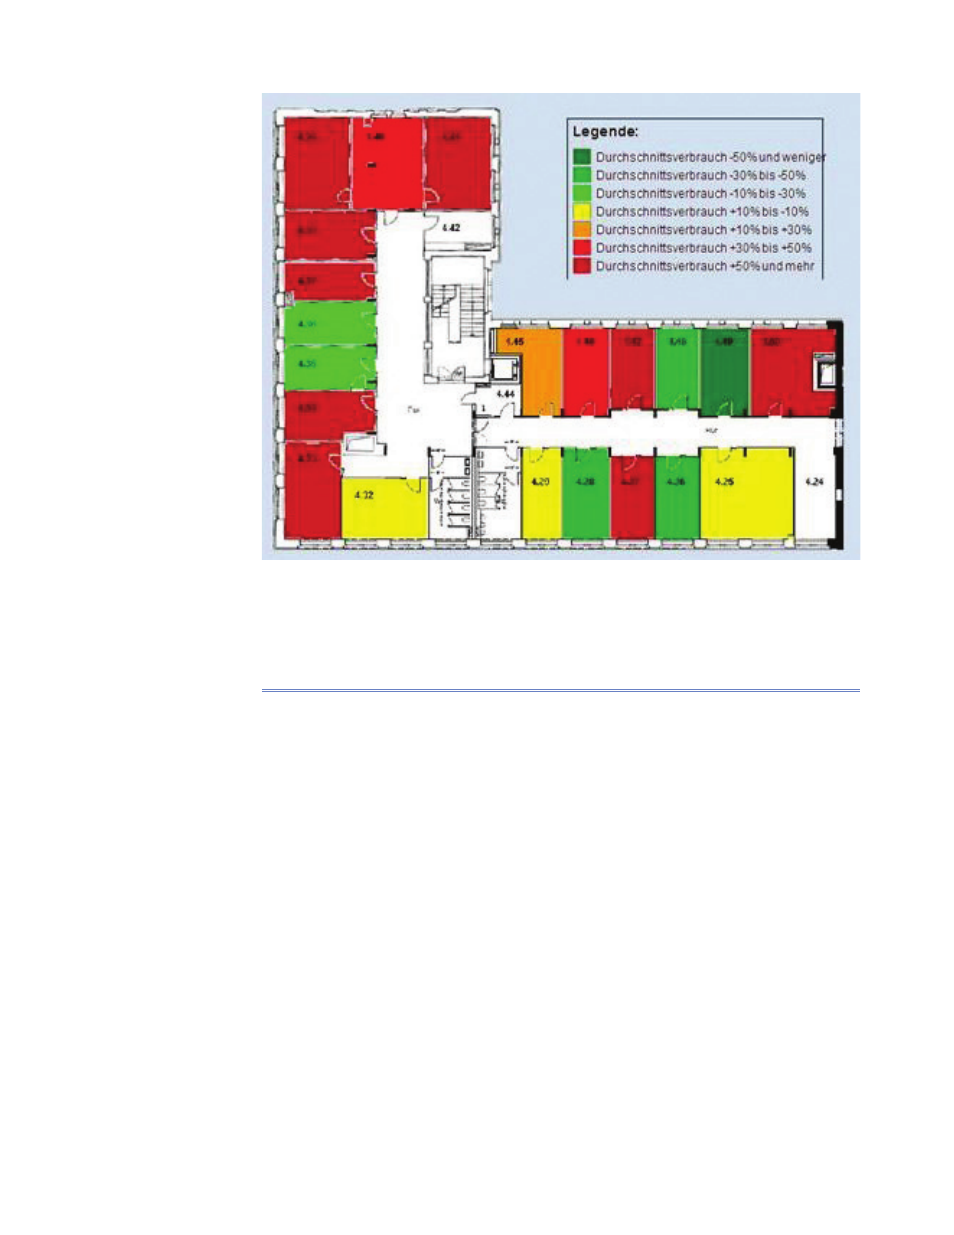
Figure N8. Heating energy consumption in an offi ce building. Note at least a factor of 4 due to
different user behavior .
N.3.5 Energy signatures
An energy signature is a visualization technique based on aggregated e.g.,
hourly, weekly or monthly values. The reason for this time “step” is that the
heat energy must be a “short time” average where the infl uence of the daily
heat storage in the building is smoothed out. The simplest form of energy
signature is related to dry outdoor air temperatures only. Further developed
forms may include for example solar isolation or wind speed.
Figure N9 displays the power consumption of a chiller in the fl ight simu-
lator building in relation to free air temperature. It can be seen that even on
lower free air temperatures signifi cant power consumption can be found.
