G.1 background – Retrotec USACE User Manual
Page 333

Appendix G G3
G.1 Background
Globally, the buildings account for 20–30% of primary energy use and emis-
sions.
1
To reduce the overall energy consumption in the building sector, design
changes, new materials, better construction practices, and commissioning
(testing) must be considered together.
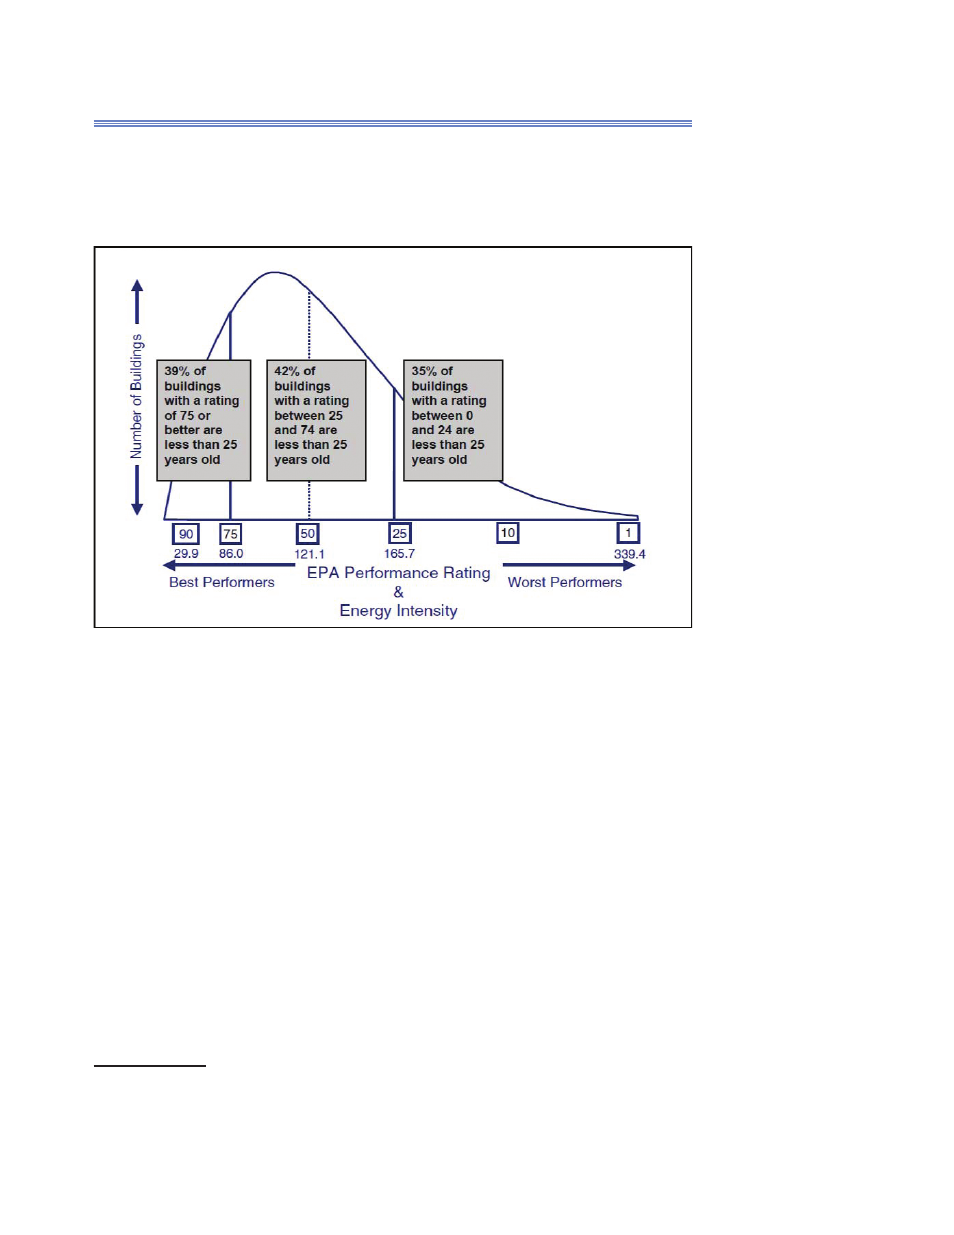
Key in this process is to evaluate and compare energy performance and
effi ciency of buildings. Energy performance rating systems such as the EPA’s
national energy performance rating system can provide an estimate for a build-
ing’s energy consumption (Figure G1).
The condition of buildings, structures, indoor air quality, and building services
can be calculated by various methods and charted, but only a condition survey
can provide actual performance characteristics of the buildings condition.
Especially for the thermal performance of buildings and structures, a reli-
able evaluation cannot be determined based only on calculations, because our
buildings diverge from the ideal ones. In many renovation cases, the appropri-
ate drawings, documents, and structural information are not available. In addi-
tion, the functioning of heating and ventilation systems also affects the thermal
performance of building envelopes.
The most effective tool in observing the thermal performance of building en-
velopes is IR thermography. The rapid development of IR cameras and image
processing technology has given new light to the use of IR thermography. This
important tool provided to the trained building investigator will help to determine
1 Coal Facts 2006 (World Coal Institute, London, September 2006).
2 US EPA Energy Star: Benchmarking Energy Use in Commercial Buildings, Alyssa Quar-
forth, March 4, 2008.
Figure G1. EPA’s energy performance rating showing the performance of 4,000 buildings
nationwide.
2
