G22 energy & process assessment protocol – Retrotec USACE User Manual
Page 352

G22 ENERGY & PROCESS ASSESSMENT PROTOCOL
44.8
68.4 °C
45
50
55
60
65
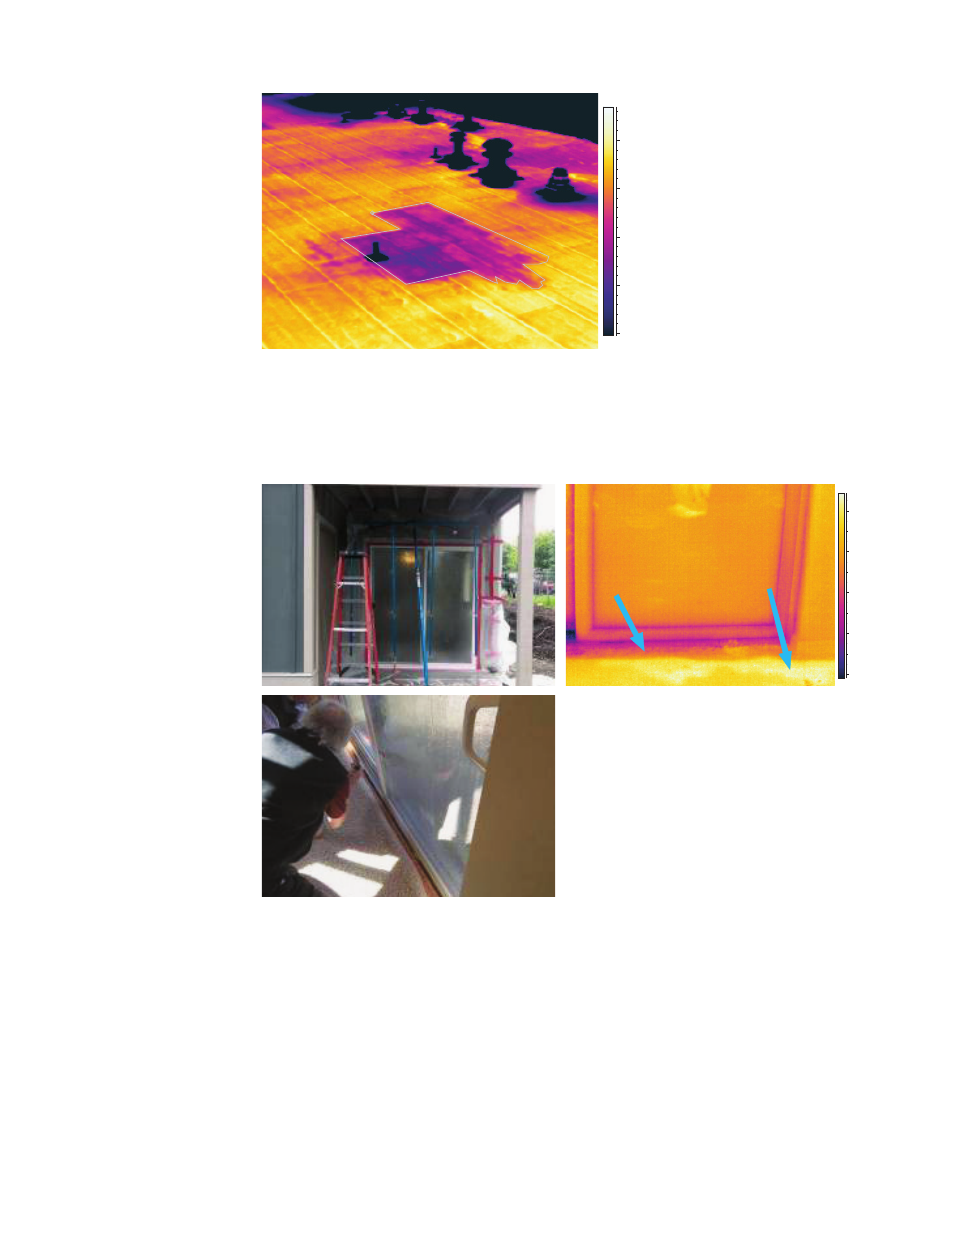
Figure G21. During the evening,
the moisture trapped in the
insulation under the roofi ng
warms slower than the roofi ng,
providing a cooler pattern after
sunrise. (Image from BCRA.)
Thermal scanning in conjunction with other supporting methods—for ex-
ample, blower door (Figures G20 and G21) or water testing (Figure G22)—
can be used to examine the performance of buildings and material properties.
In many cases, the use of IR thermography allows the investigator a clear pat-
tern, locating leaking air or water (see Figure G23).
Warm
Wet carpet
Cool
Evaporating water
53.8
62.9 °F
54
56
58
60
62
Figure G22. When performing window testing the
leaks may appear sharper using IR thermography.
(Images from BCRA.)
The consequences of actual insulation defects depend on the environmen-
tal conditions in cold climates. Such defects cause more problems, although
in warmer climates occupant comfort can be drastically affected as well. The
greatest defects can be typically found in the tightness of the air barrier; the
joints of the outer walls, ceiling, and fl oor; and the joints associated with break-
throughs (electric tubing, ventilation ducts). Defects related to the air barrier
can be typically found in an airtightness test (blower door test). For example, in
buildings with a natural ventilation system, the zero line of the pressure differ-
ence should be at window level, or about 30–50% of the height (depending on
