Retrotec USACE User Manual
Page 437

Appendix N N7
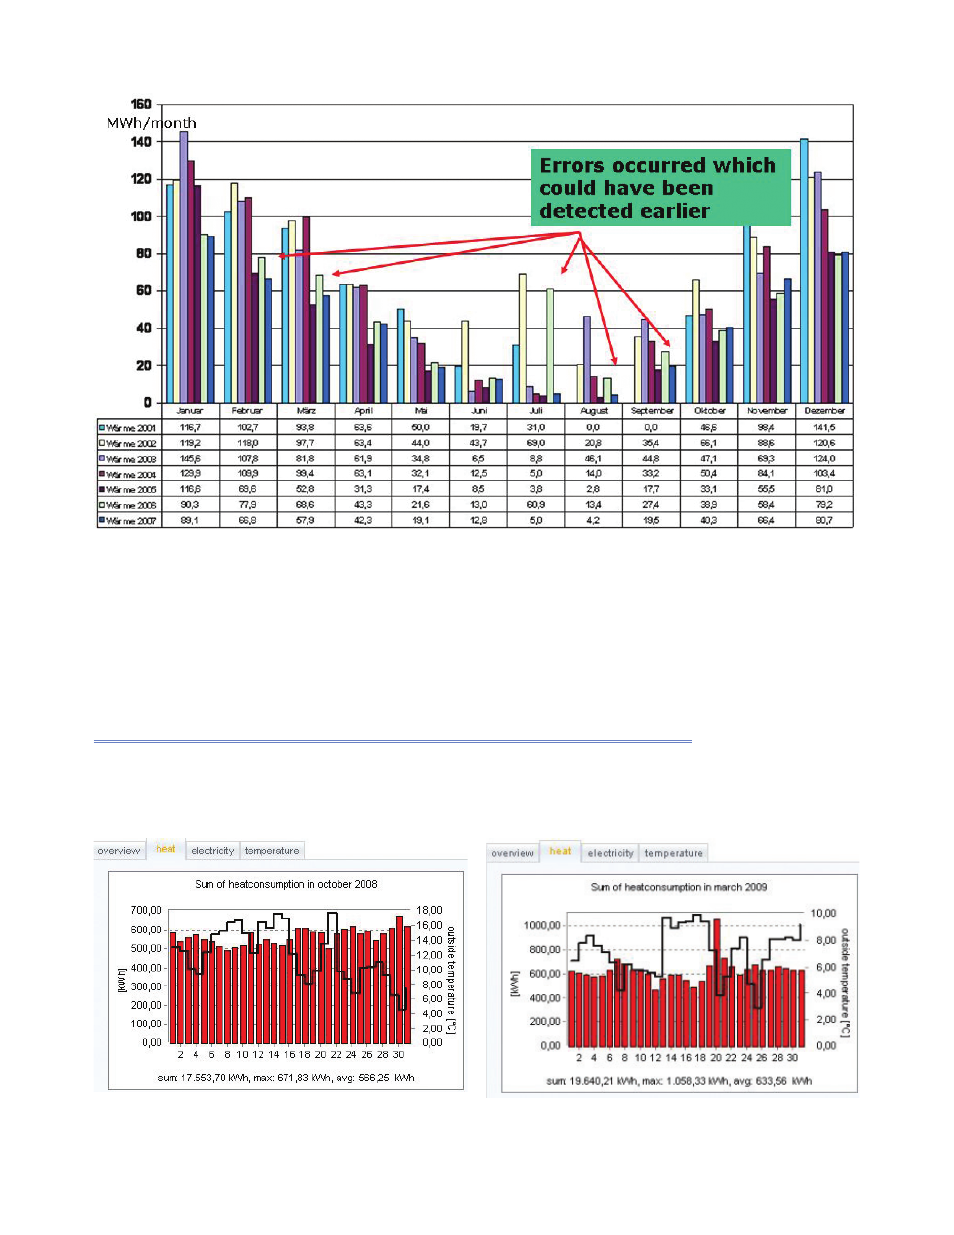
Figure N4. Temperature corrected monthly data from one building and several years.
It reveals that energy consumption increased slowly in February 2006 with a
major error in July 2006 and was brought down to the optimized value only in
November again. Continuous commissioning would have been able to detect
the ineffi ciencies much earlier.
N.3.3 Comparison of daily data from one building with outdoor
temperatures
The following examples are from the Illesheim case study of the EnerGo tool-
kit Online data can be also viewed under http://demoportal.ennovatis.de/. We
compare both daily and hourly values
Figure N5. Daily heat consumption of the fl ight simulator building compared with outdoor temperatures. Left October
2008, right March 2009.
