Retrotec USACE User Manual
Page 380

J4 ENERGY & PROCESS ASSESSMENT PROTOCOL
Temp
scale
kW/ton
scale
Condenser water return temperature
Condenser water supply temperature
Chiller kW per ton of cooling
Chilled water supply temperature
Chilled water return
temperature
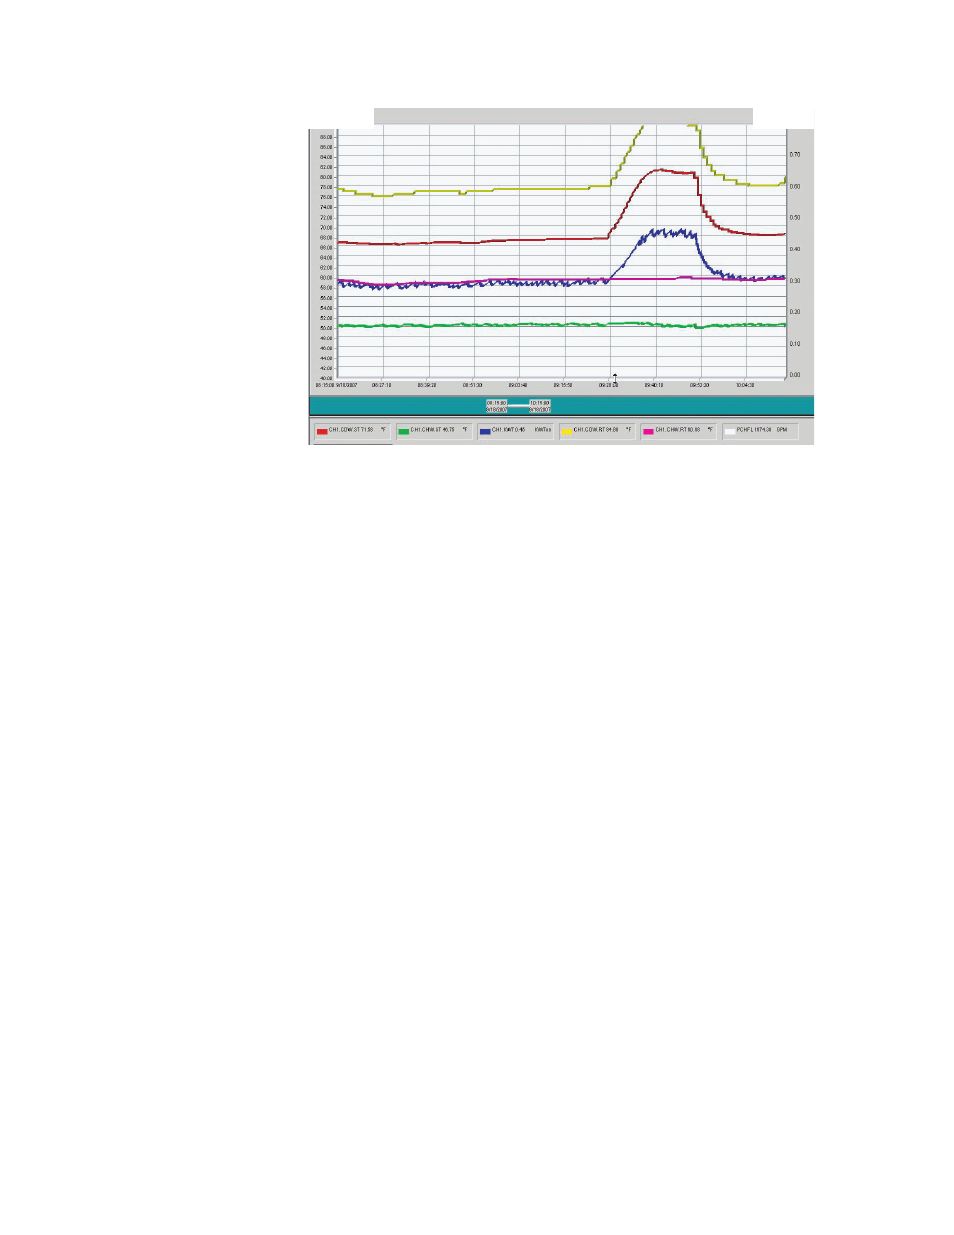
Figure J2. Example of Load-Based Optimization System (LOBOS) reset strategies in operation.
This test was run to see what effects changing the condenser water tem-
■
perature setpoint would have on VFD chiller system effi ciency.
The red line is the condenser water temperature with a system using
■
the Load-Based Optimization System (LOBOS) control system, which
determines less wasteful, more effi cient operating points for the heat-
ing, ventilating, and air-conditioning (HVAC) system based on the
actual cooling loads of the facility.
The blue line is the chiller effi ciency in kW per ton.
■
The green line is the chilled water supply temperature.
■
The test shown in the trend log screenshot shows that the chiller
■
energy effi ciency is running at approximately 0.33 kW per ton prior to
the start of the test.
This is excellent effi ciency, as most chillers installed today operate
■
between 0.60 and 1.5 kW per ton of cooling.
With LOBOS, the condenser water temperature is running at approxi-
■
mately 20 °C (68 °F), while the chilled water temperature is running at
approximately 10 °C (50 °F).
We manually raised the condenser water setpoint to 26.7 °C (80 °F)
■
from the automatically controlled setpoint of 68 °F to determine what
effect a “normal” operating strategy would have on chiller system per-
formance. Many facilities routinely operate their condenser water sys-
tems at between 26.7 and 29.4 °C (80 and 85 °F), the typical “design”
points for chillers when they leave the chiller factory.
As can be seen, the chiller effi ciency was made dramatically worse
■
when the CHWS temperature was raised by 11.1 °C (12 °F), increas-
ing from 0.33 kW per ton to 0.45 kW per ton, using 36% more energy
