Retrotec USACE User Manual
Page 435

Appendix N N5
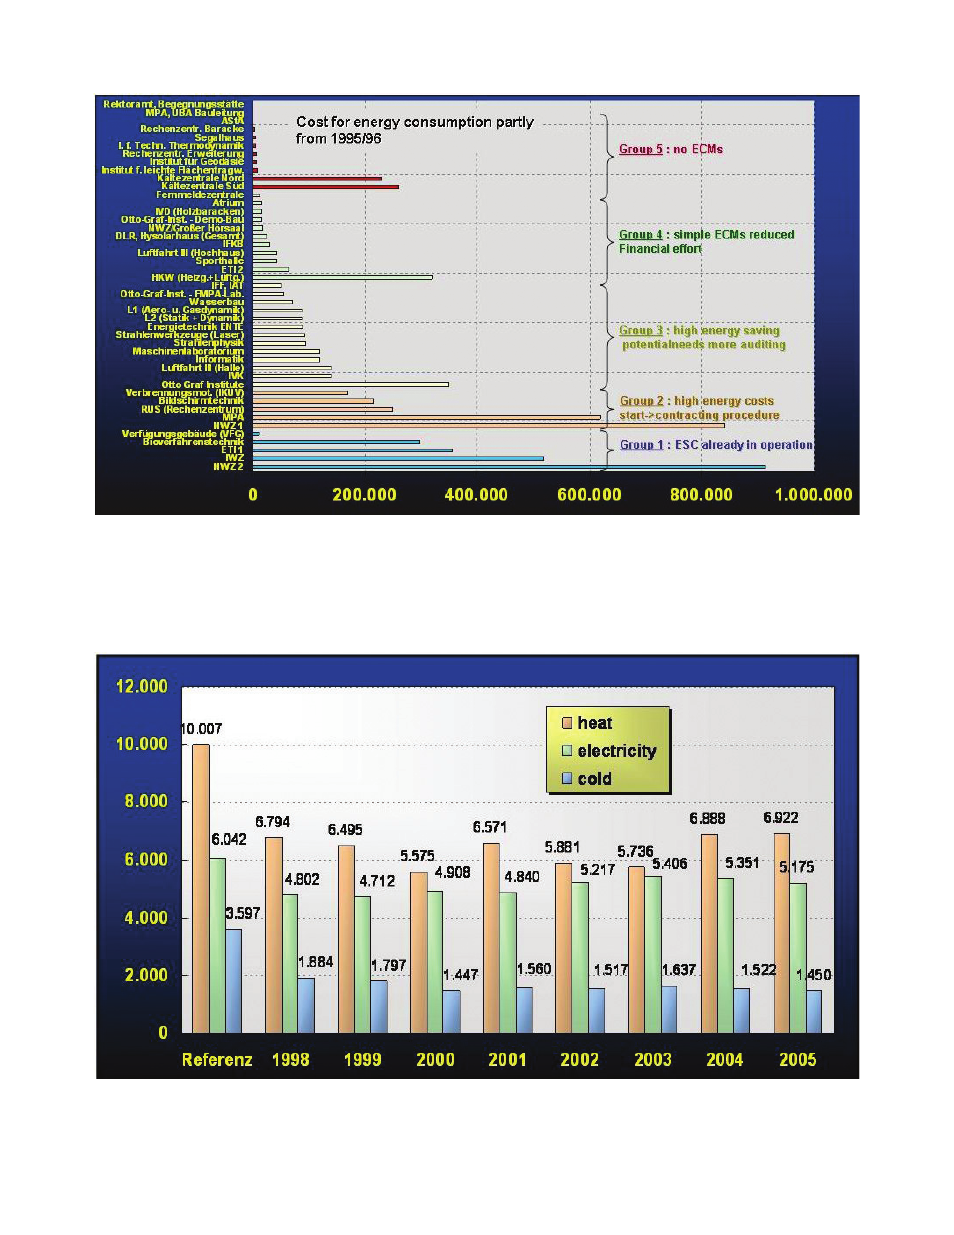
Figure N1. Yearly consumption data to classify the buildings of the University of Stuttgart building side.
The yearly presentation may also be used to demonstrate the sustainability of
ECMs at one building. Again we take as an example the case study from the
University of Stuttgart. The Figure N2 gives energy consumptions over several
yearsbefore and after retrofi t such demonstrating savings in absolute values.
Figure N2. Energy consumption at the University of Stuttgart before and after retrofi t—variations are due to different
climate and usage.
