G10 energy & process assessment protocol – Retrotec USACE User Manual
Page 340

G10 ENERGY & PROCESS ASSESSMENT PROTOCOL
One should not confuse the thermal resolution with the measurement ac-
curacy of the temperature, which is typically ±2 °C (± 3.6 °F) when using
IR thermography. In most cases, for building thermography, the temperature
value of the object is not as important as the temperature differences or pat-
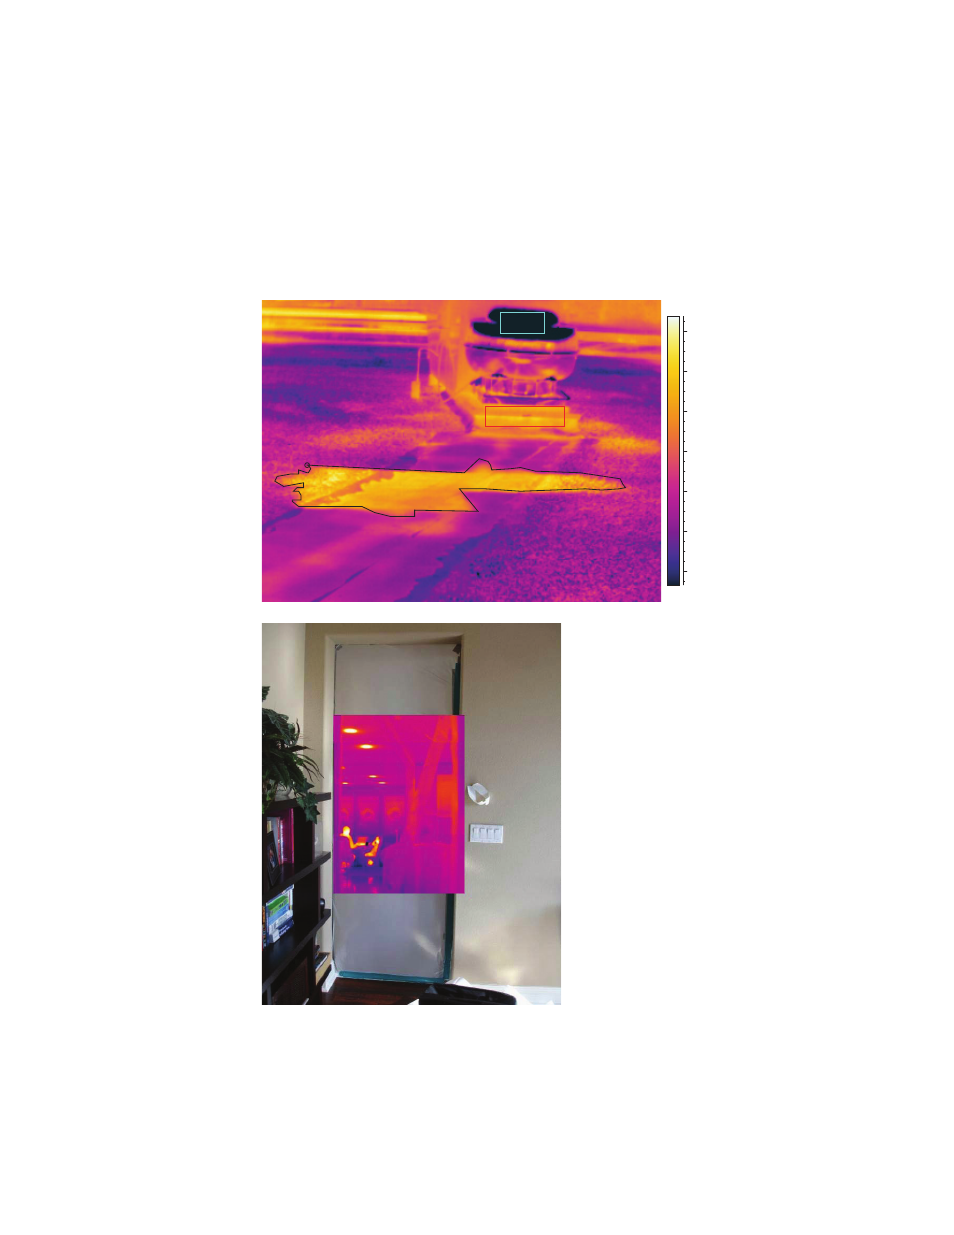
terns observed in the area in question. The image shown in Figure G6 is an
example of wet insulation trapped under the roofi ng showing a warm pattern
outlined in black, labeled “trapped moisture.” It is not the actual temperature,
but the pattern of a warm temperature, that provides the thermographer with
the correct interpretation.
Hot:max 22.3
Trapped moisture
Cold:min –17.4
11.3
24.7 °C
12
14
16
18
20
22
24
Figure G6. In the
IR thermograph
below, the apparent
temperature of the
vent has a minimum
temperature of
–17.4°C (0.68 °F).
This is an example
of refl ection of the
cold sky on the top
of the vent. (Image
from John Fricot, FLIR
Systems.)
Figure G7. The IR camera viewing through thin
plastic, showing an example of transmission.
(Image from Building Science Institute.)
