I-10.3 alarm display 37, I-10.4 graphic trend curve 37, Alarm display 37 – West Control Solutions KS98-1 User Manual
Page 37: Graphic trend curve 37, Zoom value scale 37, Ь* ц д # < > c x
I-10.3
Alarm display
Alarm display is in the order of occurrence on a list.
One alarm per line is displayed:
Alarm active
alarm text blinks
Alarm active and ackn.
Alarm text
Alarm not active any more
Alarm text
uuu
and not acknowledged
Alarm not active any more
--------------------
Acknowledging an alarm
Select an active alarm for acknowledging with ID and acknowledge it with M. New alarms are displayed only
when rebuilding the page, which is done by pressing key H.
I-10.4
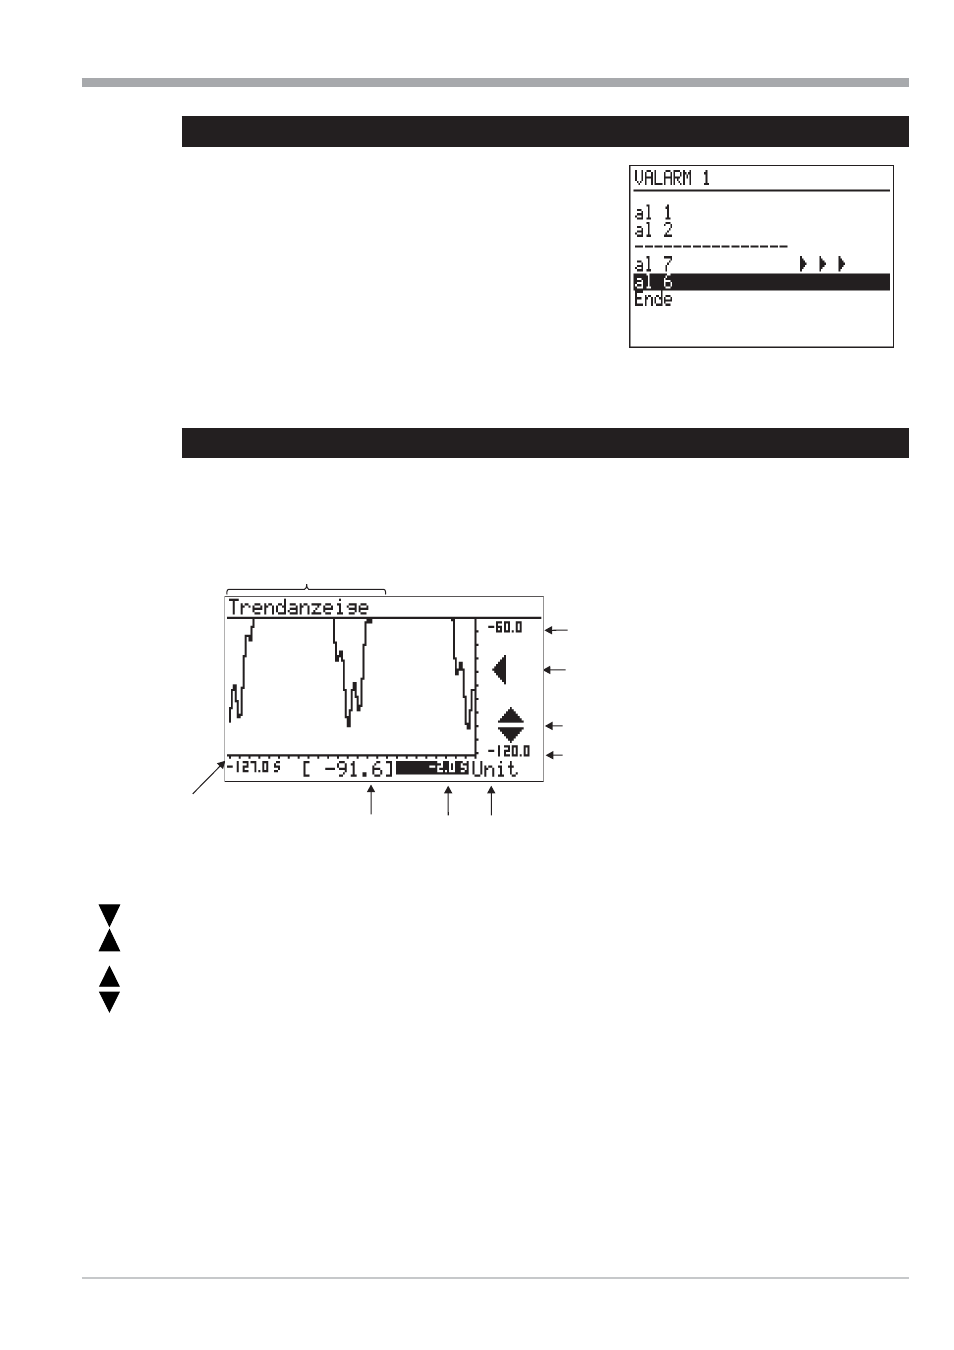
Graphic trend curve
The time curve of a process is displayed graphically on the trend page.
Ü
Title
*
+¢ Scale end values
ä
Zoom switchover
#
Value at time > / actual input value
<
Unit of value
>
Origin of time axis related to the actual
value
(=0) shift of time axis (scrolling into the
past)
x
Axis shift signalling
c
End of time axis / earliest value in the
displayed trend
Zoom value scale
The value axis can be zoomed by factor 1:4 (cut-out magnification).
Select the "zoom" field £, press M, the zoom symbol changes. Now, scaling can be changed by means of keys ID.
The scaling is shifted in steps of 12,5% via field ¢.
Shift of time axis:
Earlier values than those visible in the actual window are also displayed by the trend function (Shift). Values left of
the time axis are earlier values. These values can be displayed by changing the origin of the time axis.
Select field > with ID and shift the scale origin by changing the value.
+
Symbol
t (x) indicates the shift.
When resetting the time scale to 0, the shift is switched off.
9499-040-82711
Operating pages
Alarm display
I-37
Ь
*
Ц
д
#
<
>
c
x
Fig. 18