Metrohm 797 VA Computrace User Manual
Page 156
5 Determination mode
797 VA Computrace – Software
144
mean(n)
Mean value of all evaluation quantities for
spiked sample n
Std.dev.(n)
Standard deviation of the individual value
EV(n)
= s(n)
c(n) – c(s)
Difference in the mass concentrations be-
tween the spiked sample n and the origi-
nal sample solution
3. Determination of standard addition curve
For the calculation of the linear standard addition curve, the
parameters a and b of the linear regression curve y = a + bx
are calculated by weighted least square minimization with
y =
EV
and x = c – c(s). The weight factor for each point is
the standard deviation obtained from the replications. The pa-
rameters a and b are displayed in the
RESULTS
window and
have the following meaning:
a =
Y.reg/offset
Intercept of std.add. curve
b =
Slope
Slope of std.add. curve
4. Calculation of mass concentration c(s)
A requirement for the use of the standard addition is that when
c = 0 the evaluation quantity
EV
= 0. If 0 is substituted for
these two quantities in the calibration function, the sought
mass concentration c(s) can be calculated from the equation:
c(s) = a / b
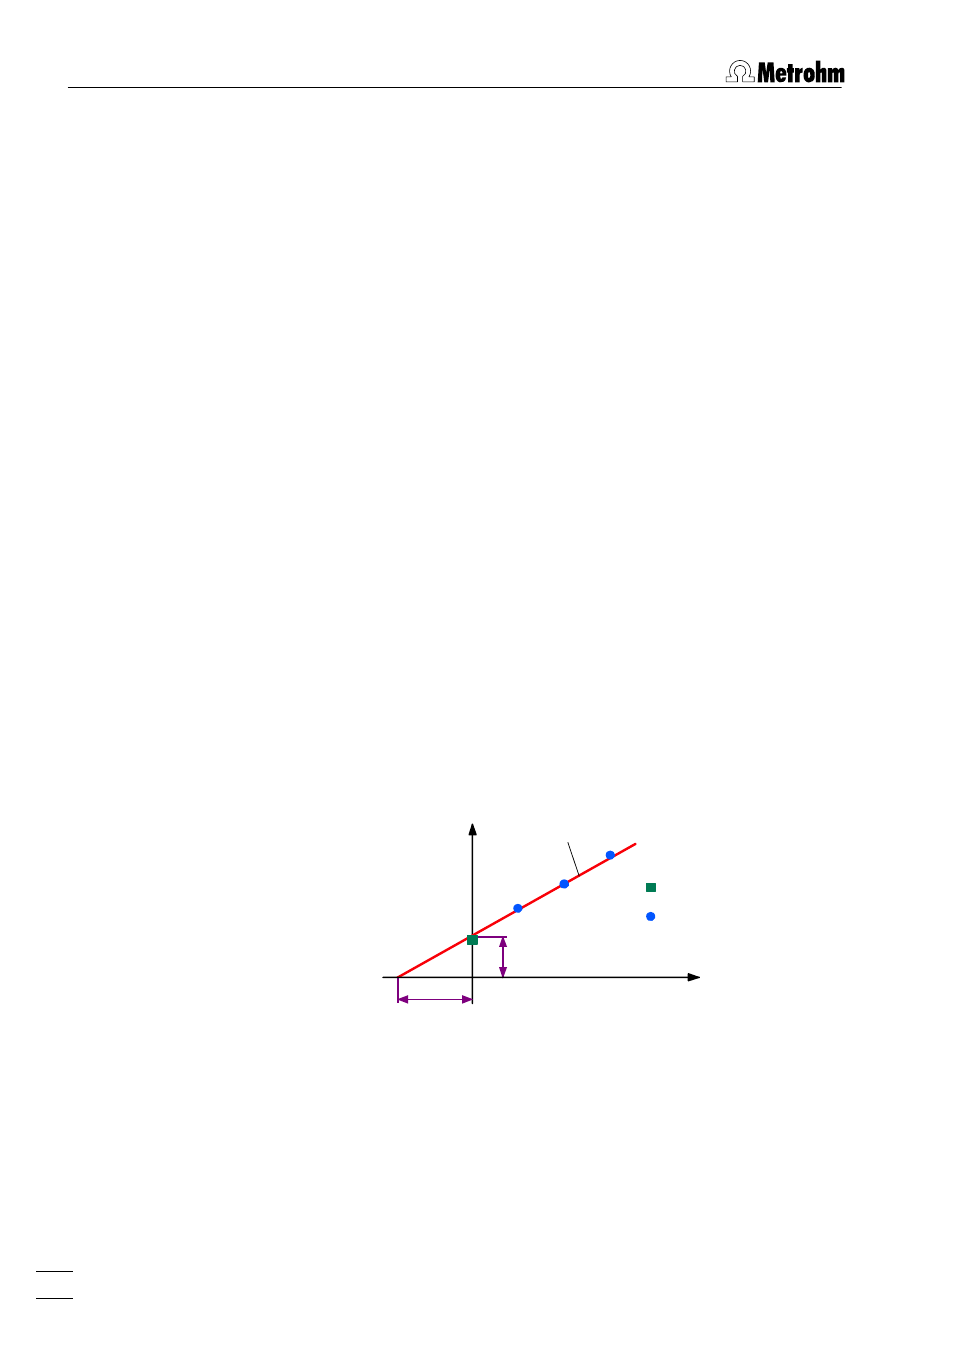
In the graphical representation of the standard addition curve,
the sought mass concentration on the x-axis is given by the dis-
tance between the zero point and the intersection point with
the calibration function.
EV
0
c(s)
c - c(s)
Y.reg/offset
Sample
Standard additions
Slope
5. Calculation of result deviation Conc.dev.
The total deviation of the calculated substance concentration
Conc.
is determined using a linear error calculation. Indepen-
dent of the number of measurements, the total deviation
Conc.dev.
is always calculated in a way that
Conc.
±
Conc.dev.
gives the range in which the mass concentration
may be expected with a probability of 68.3%.