Graphical properties for monitoring curves – Metrohm 797 VA Computrace User Manual
Page 129
5.3 Monitor
797 VA Computrace – Software
117
Calibration curve id [ 32 characters ; "sample" ]
Identification for calibration curve.
Add the calibration solution into the measuring
vessel and press
.
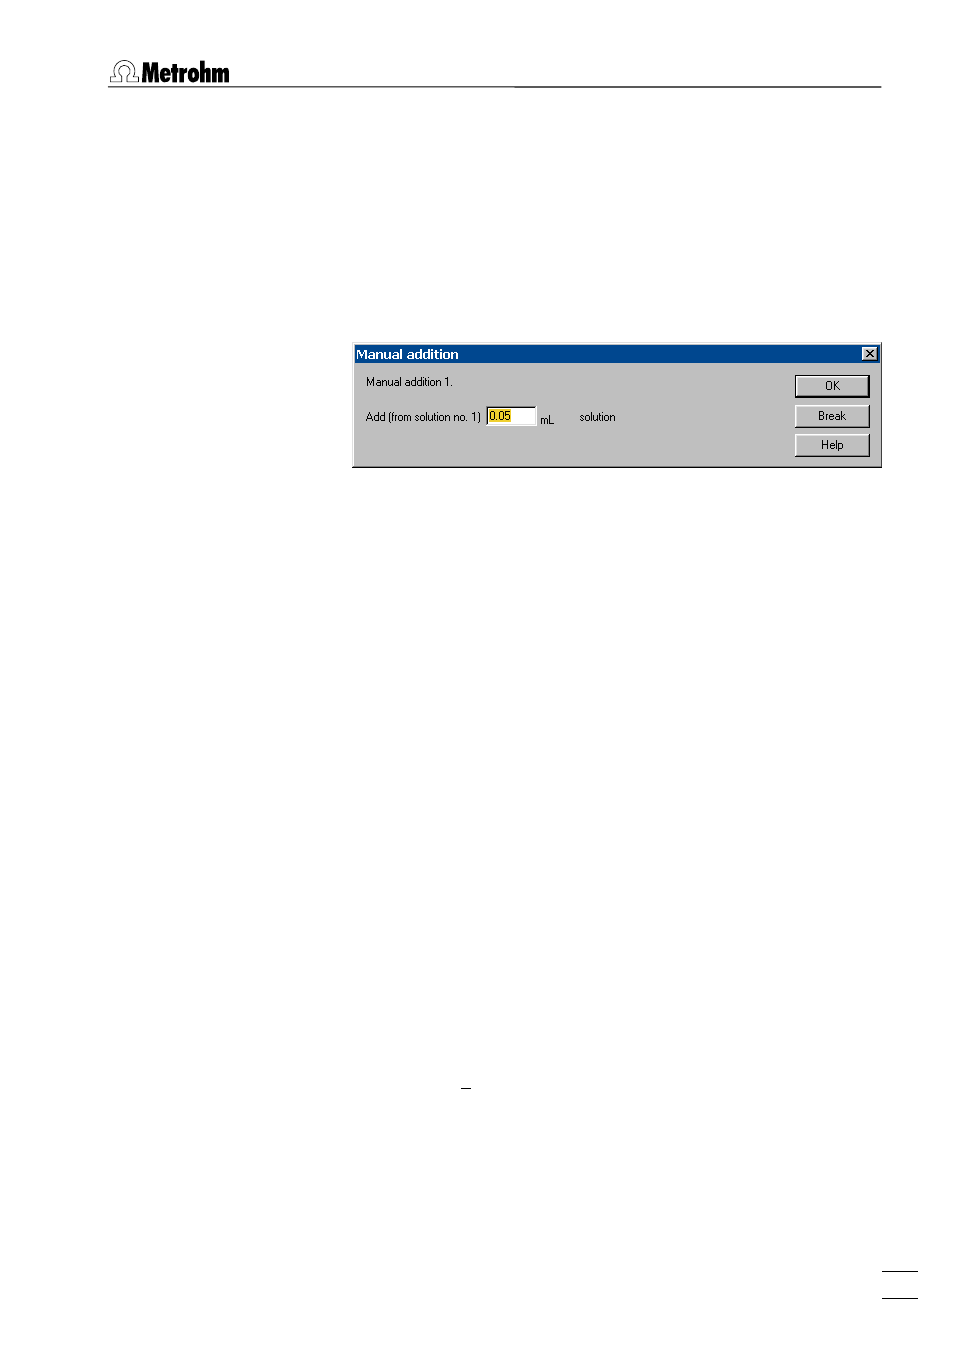
MANUAL ADDITION
This window appears at the start of each manual
addition of standard solutions for standard addi-
tion determinations or the recording of calibration
curves.
Add (from solution no. X) (ml) [ > 0.01 ml ; 0 ml ]
The addition volume for the manual addition de-
fined in the
Substances
tab is displayed and can be
changed if desired. Add the addition solution into
the measuring vessel and press
.
BATCH SOLUTION EXCHANGE
This window appears if the
Batch with solution ex-
change
option is selected for the measurement
technique. The number of the solution to be pla-
ced and the substances and their concentration
defined in the
Substances
tab are displayed. Add
this solution into the measuring vessel and press
.
END OF DETERMINATION
This window appears at the end of the determina-
tion. By pressing
, the determination is
automatically saved if the
Auto save determination
and signal
option is enabled in the
General
tab of
the
GENERAL SETTINGS
window. The report ele-
ments checked in the
Documentation
tab are au-
tomatically printed out.
Graphical properties for monitoring curves
The graphical properties for curves in the
MONITORING
window
can be set by selecting the options of the context sensitive menu.
MONITORING / Page properties
The page properties of the
MONITORING
window
can be set with the
page
tab of the
GRAPHICAL
PROPERTIES
window (details see Page properties,
section 3.5).
The properties of the x and y axis can be set with
the
x axis
and
y axis
tab of the
GRAPHICAL PROP-