1 architecture -3, Figure 11-1. in-circuit debugger -3, 1 architecture – Maxim Integrated MAXQ7666 User Manual
Page 299
SECTION 11: IN-CIRCUIT DEBUG MODE
The MAXQ7665/MAXQ7666 are equipped with embedded debug hardware and embedded ROM firmware developed for the purpose
of providing in-circuit debugging capability to the user application. The in-circuit debug mode uses the JTAG-compatible TAP as its
means of communication between the host and MAXQ7665/MAXQ7666 microcontrollers. The in-circuit debug hardware and software
features include the following:
• A debug engine
• A set of registers providing the ability to set breakpoints on register, code, or data
• A set of debug service routines stored in a ROM
Collectively, these hardware and software features allow two basic modes of in-circuit debugging:
• Background mode allows the host to configure and set up the in-circuit debugger while the CPU continues to execute the normal
program. Debug mode can be invoked from background mode.
• Debug mode allows the debug engine to take control of the CPU, providing read-write access to internal registers and memory,
and single-step trace operation.
11.1 Architecture
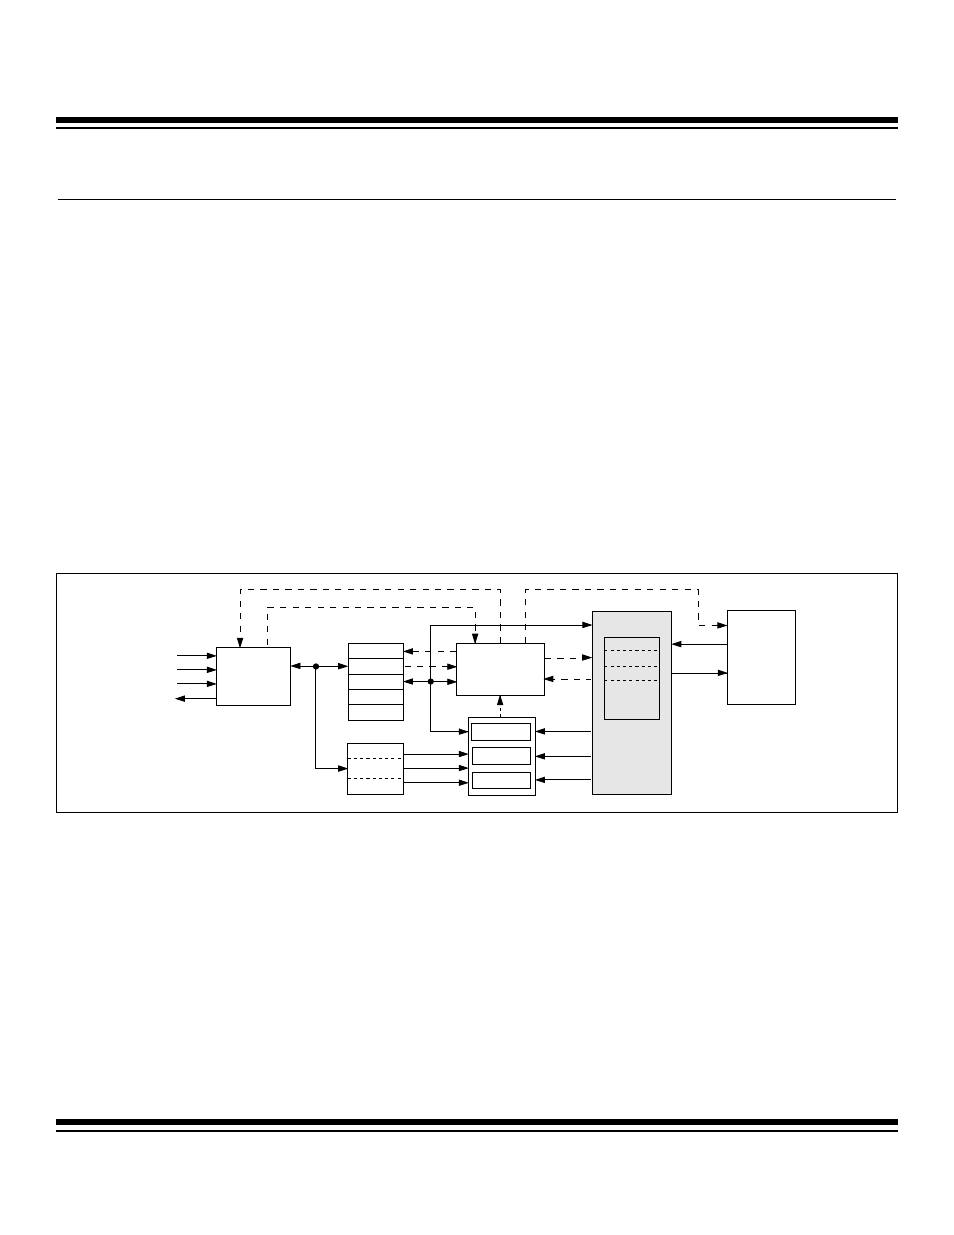
Figure 11-1 shows a simplified functional block diagram of the MAXQ7665/MAXQ7666 in-circuit debugger. The embedded hardware
debug engine is implemented as a stand-alone hardware block in the MAXQ7665/MAXQ7666 microcontrollers. The debug engine can
be enabled for monitoring internal activities and interacting with selected internal registers while the CPU is executing user code. This
capability allows the user to employ the embedded debug engine to debug the actual system, in place of the in-circuit emulator that
uses external hardware to duplicate operation of the microcontroller outside of the real application environment.
The embedded debug engine is a state machine that takes commands from the host device and performs the necessary tasks to com-
plete the debug function. While the TAP is running at the TCK clock frequency, the debug engine and all its associated hardware are
clocked by the system clock. The debug engine is not operated in stop mode.
All debug engine activities are originated by the external host through 8-bit commands. The debug engine decodes the command in
the ICDB register directly, and provides the following functions for use in debugging application software:
• Single-step (trace) execution
• Four program address breakpoints
• Two breakpoints configurable as data address or register address break points
• Register read and write
• Program stack read
• Data memory read and write
• Optional password protection
MAXQ7665/MAXQ7666 User’s Guide
11-3
Figure 11-1. In-Circuit Debugger
TMS
TDO
TDI
TCK
CPU
ROM
DEBUG
ENGINE
BREAKPOINT
BREAK
ICDB
ICDF
ICDC
COMPARATOR
COMPARATOR
COMPARATOR
CODE ADDR
DATA ADDR
REG DATA
IP
IR
DATA
ADDR
ENABLE
ICDA
ICDD
TAP
CONTROLLER
Maxim Integrated