Light intensity screen, Display of measured value, Display of received light intensity graph – KEYENCE LT-9001 Series User Manual
Page 74: Setting the light intensity level
Operations
and
Fun
ction
Settings
in
the
Profile
Mode
4
Chapter
E LT-9001-IM
On the light intensity screen, the measured value
and the received light intensity waveform graph
can be displayed. The light intensity level and
area range can be set on this screen.
Refer to "Chapter 5 Common Operations and
Function Settings" (page 5-1) for common settings
used with the displacement mode.
This section describes the display of a measured
value.
There are two types of display on the light intensity
screen, similar to the measurement screen.
• Single display of OUT1 or OUT2
• Double display of OUT1 and OUT2
Refer to "Display of Measured Value" (page 4-5) for
switching the single and double displays.
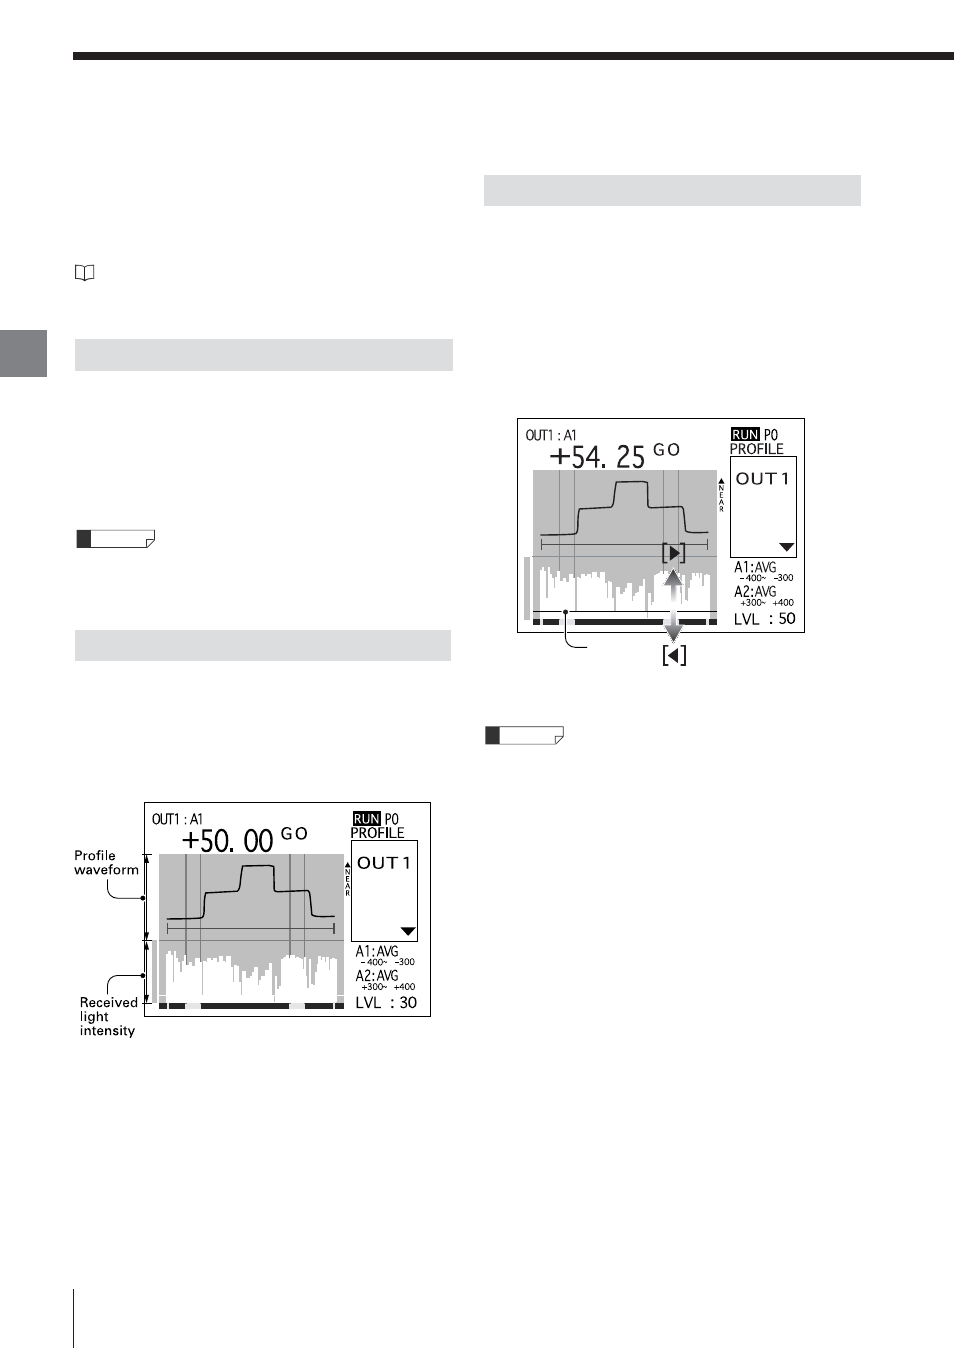
This screen displays the received light intensity
from the measurement target surface in the graph.
The screen is divided into two areas and displays the
profile waveform graph in the upper area and the
received light intensity graph in the lower area.
Display of Received Light Intensity Graph
Reference
Display of Measured Value
Light Intensity Screen
4-8
The value, which is set as a threshold for the
amount of light to be measured or not, is called
the light intensity level.
The light intensity level is set by using the [t] and
[s] buttons to move the horizontal yellow cursor on
the light intensity screen.
On the light intensity screen, the light intensity level is
displayed in [LVL].
• Set the light intensity level as high as possible
within the range where the profile can be measured
correctly.
• The measurement target surface of the highest light
intensity is measured in the profile mode.
Reference
Setting the Light Intensity Level
Lignt
intensity
level