Light intensity screen, Display of measured values, Display of received light intensity graph – KEYENCE LT-9001 Series User Manual
Page 53
3
Chapter
Operations
and
Fun
ction
Settings
in
the
Displacement
Mo
de
E LT-9001-IM
3-7
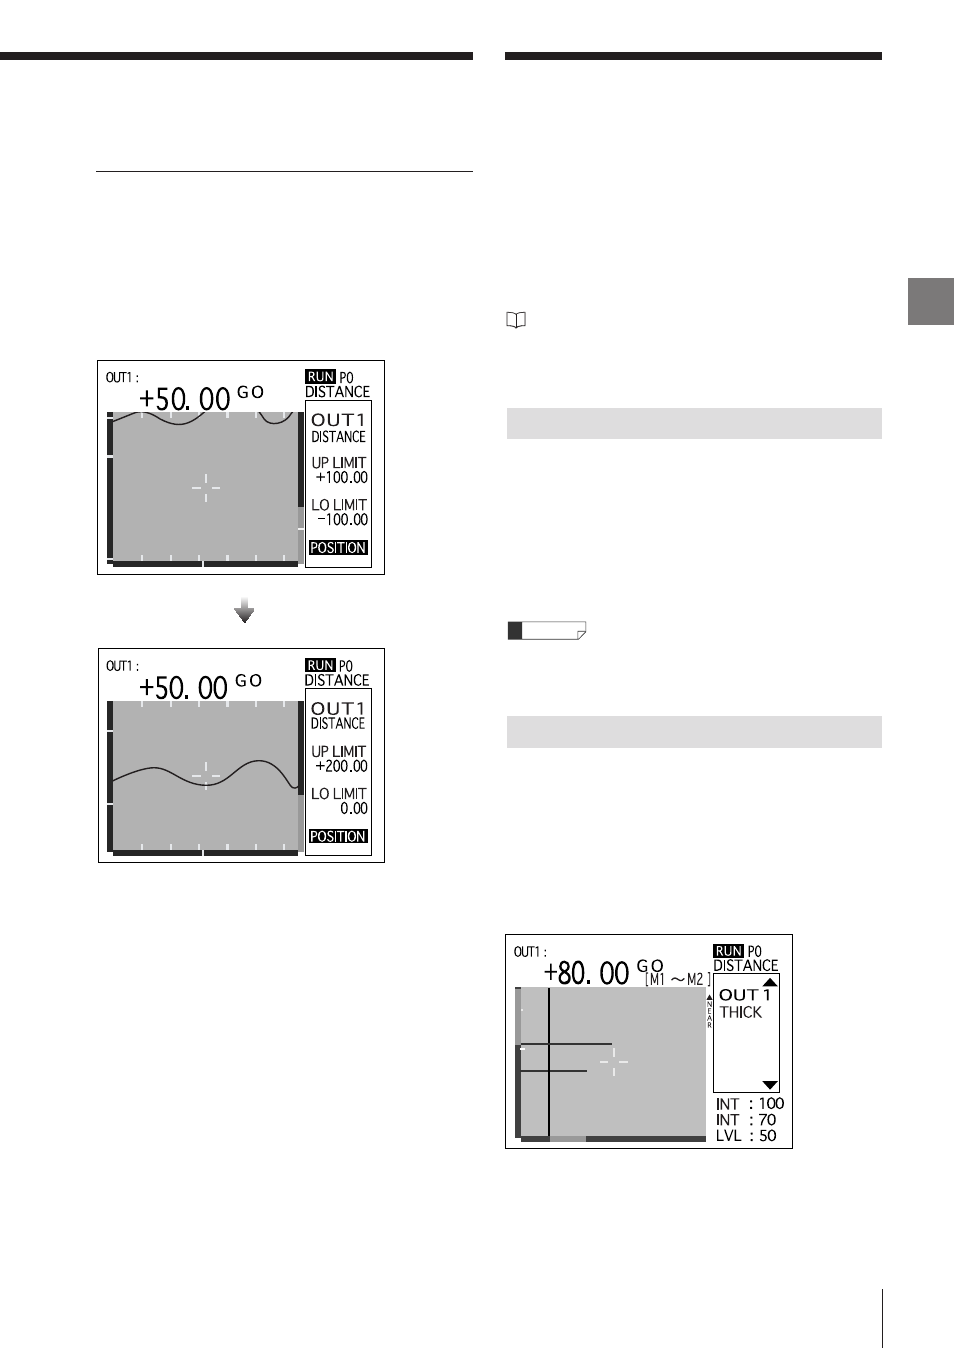
Setting the position
It is difficult to see the trend graph when it is out of
the display area. In such a case, select [POSITION]
and press the [ENTER] button. The [UP LIMIT] and
[LO LIMIT] are adjusted automatically and the trend
graph is displayed in the center of the screen.
Light Intensity Screen
On the light intensity screen, the reflective light
from a measurement target is indicated.
The measured value and the light intensity peak
can be displayed in a bar graph. Also, the light
intensity level and the measurement target
surface can be set.
Refer to "Chapter 5 Common Operations and
Function Settings" (page 5-1) for common settings
used with the profile mode.
This section describes the display of measured
value.
There are two types of displays on the light intensity
screen, similar to the measurement screen.
• Single display of OUT1 or OUT2
• Double display of OUT1 and OUT2
Refer to "Display of Measured Value" (page 3-5) for
switching the single and double display.
This screen displays the received light intensity
from the measurement target surface in the graph.
The four highest values in the measured light
intensity peaks are displayed in the graph.
Target surface 1 is displayed in yellow-green and
target surface 2 is in light blue.
Display of Received Light Intensity Graph
Reference
Display of Measured Values
The [ENTER] button