Display of profile waveform – KEYENCE LT-9001 Series User Manual
Page 72
Operations
and
Fun
ction
Settings
in
the
Profile
Mode
4
Chapter
E LT-9001-IM
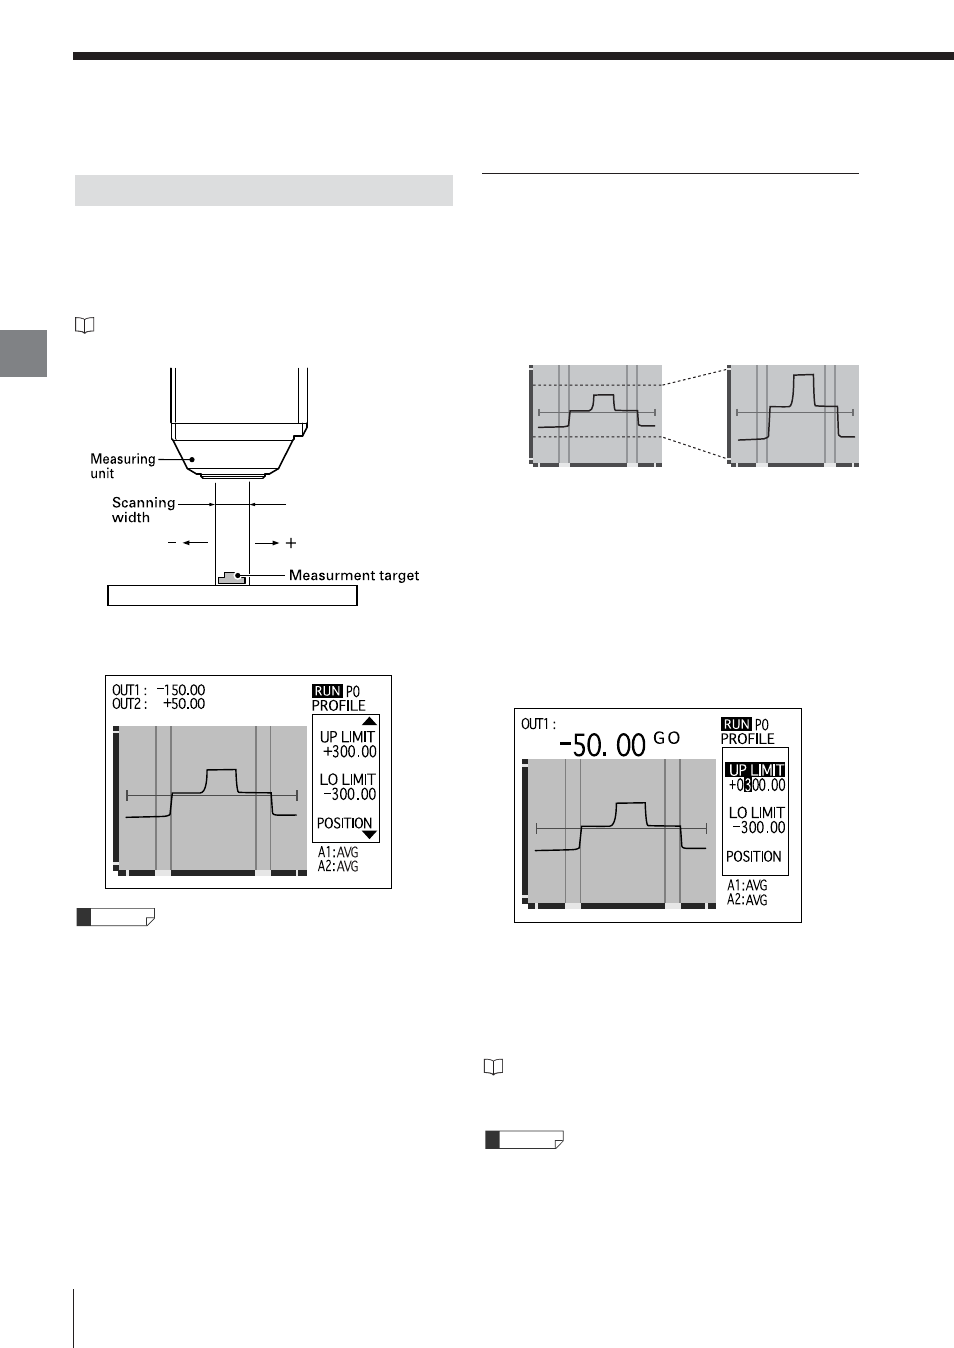
The profile waveform is a graph consisting of point
data within the scanning width, placed in line. The
profile waveform of the measured target within the
range of the scanning width can be displayed.
Refer to "SCAN" (page 4-14) for scanning
width/interval.
The profile of a measurement target is displayed as
shown below.
The measurement target surface of the highest light
intensity is measured in the profile mode.
Reference
Display of Profile Waveform
4-6
Measurement Screen
Setting the upper and lower limits of the
profile waveform graph display
It is possible to set the upper and lower limits display
according to the shape of the measurement target in
the profile waveform graph.
Any part of the graph can be zoomed in on by
scaling the upper and lower limits.
The procedure used to set [UP LIMIT] and [LO LIMIT]
is explained as follows.
1
Select [UP LIMIT] with the [ENTER] button.
The cursor is placed on [UP LIMIT].
2
Select [UP LIMIT] or [LO LIMIT] by using the
[
▲] and [▼] buttons and press the [Enter]
button.
3
Press the [ENTER] button after changing the
value.
The value you entered is fixed.
Refer to "Default Values and Setting Range"
(page 2-25) for the setting range and limitations.
If the [ZERO] button is pressed while entering the
value, the parameter is set to "0".
Reference
+300
+200
-300
-100