Boonton 4500b rf peak power analyzer – Boonton 4500B Peak Power Meter User Manual
Page 320
Boonton 4500B RF Peak Power Analyzer
Application Notes
6-10
Item
dBm
mW
Mesial value
10.0
10.0
Sample n
8.0
6.3
Sample n+1
11.0
12.6
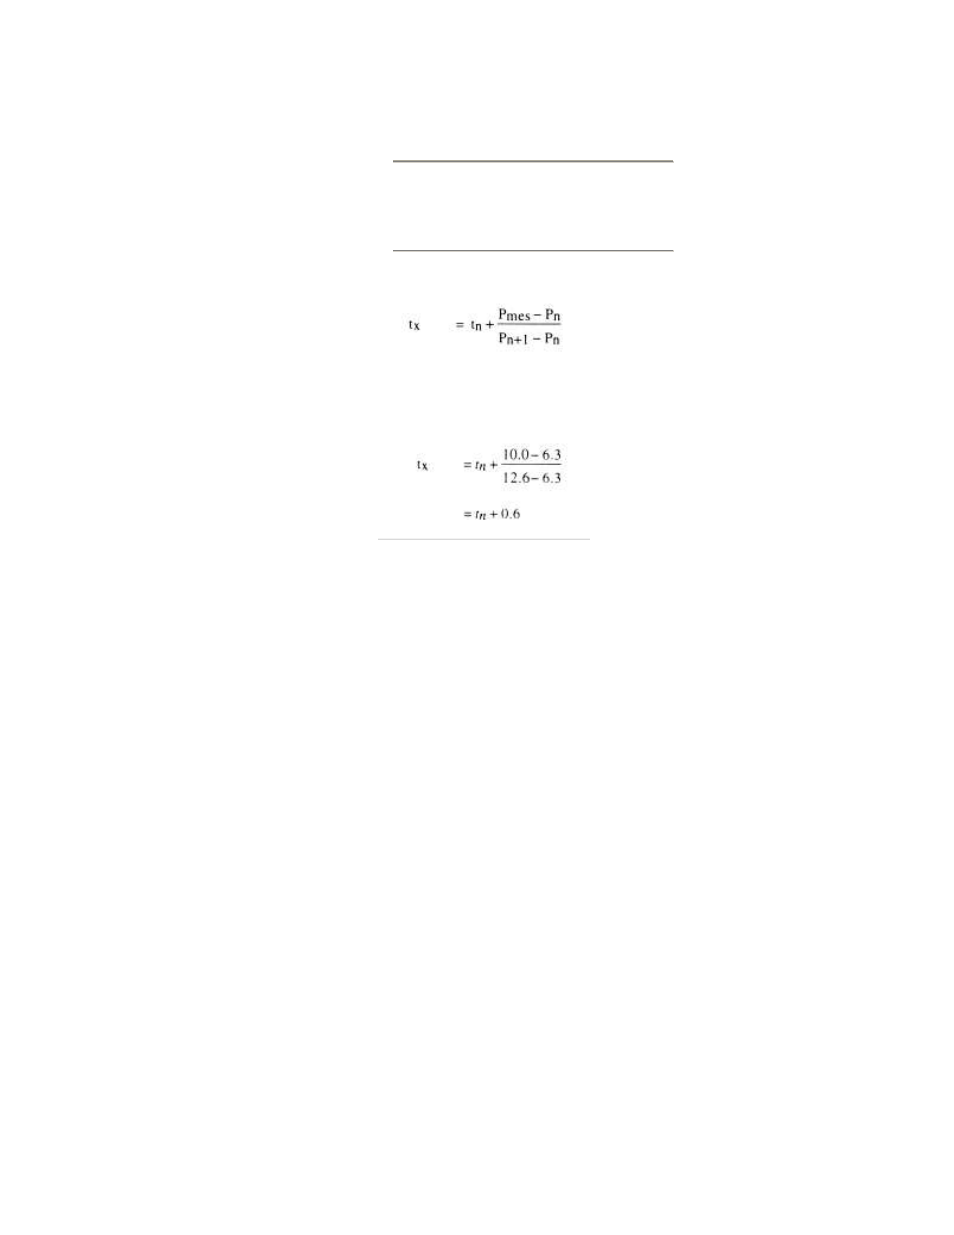
The interpolated crossing time,
t
x, is calculated from:
where P is in watts and n is the number of the sampling interval, referenced to
the trigger event. For this example
11. The processor computes the rise and/or falltimes of waveforms that meet the
following conditions:
a) The waveform must have at least one usable edge (Types 2 through 7).
b) The signal peak must be at least 13 dB greater than the minimum sample
value.
The risetime is defined as the time between the proximal and distal crossings
(– +).
The falltime is defined as the time between the distal and proximal crossings
(+ –).
If no samples lie between the proximal and distal values for either edge (rise or
fall), the risetime for that edge is set to 0 seconds