Table 4-11. mark > menu, Table 4-11. mark > menu -52, Boonton 4500b rf peak power analyzer – Boonton 4500B Peak Power Meter User Manual
Page 124: Operation
Boonton 4500B RF Peak Power Analyzer
Operation
4-52
Procedure
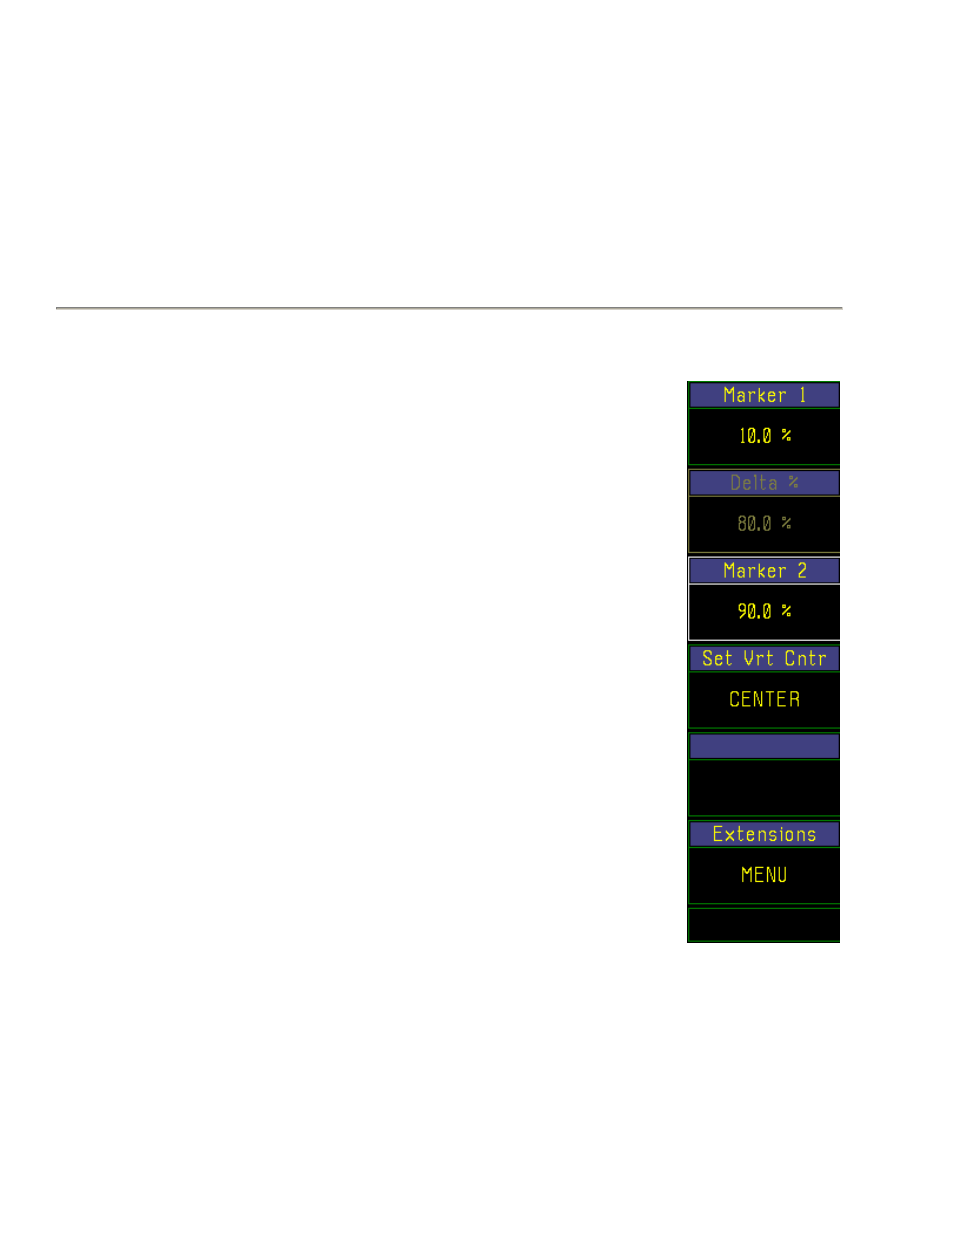
To make time interval measurements, position Time Marks 1 and 2 at the beginning and end of the interval
you wish to measure. The time interval measurement appears in the Mark > Delta Time window. The
resolution of time interval measurements depends on the timebase selection (see Subsection 4.10).
Table 4-11. Mark > Menu
Menu Item
Function
(Type)
Selections
(SCPI cmd)
Marker #
Pulse & Mod
Controls the position of Marker # in time units.
(Numeric)
Continuous Range:
(Left and Right
Press the Mark > Marker # menu key to
boundaries of the activate this function.
display.)
Use any of the data entry controls to position
the time marker anywhere within the left and
right boundaries of the waveform display. The
marker position is expressed as the time offset
relative to the trigger event.
Stat
Controls the position of Marker # in percent.
Continuous Range:
(Left and Right
Press the Mark > Marker # menu key to
boundaries of the
activate this function.
display.)
Use any of the data entry controls to position
the percent marker anywhere within the left
and right boundaries of the distribution
display. The marker position is expressed as
the percent of total occurrence.
MARKer[1/2]:POSItion:TIMe
MARKer[1/2]:POSItion:PERcent
<0 thru 100> (percent)
MARKer[1/2]:POSItion:PIXel <0 thru 500>
Delta Time
Pulse & Mod
Displays the time difference between
(None)
Marker 1 and Marker 2
The value that appears in this window is
automatically calculated by the instrument. Fig. 4-28. Mark > menu
Stat
Displays the percent difference between
Marker 1 and Marker 2
The value that appears in this window is
automatically calculated by the Model 4500B.