Automatic measurement sequence, Automatic measurement sequence -8, Boonton 4500b rf peak power analyzer – Boonton 4500B Peak Power Meter User Manual
Page 318
Boonton 4500B RF Peak Power Analyzer
Application Notes
6-8
Automatic Measurement Sequence
The automatic measurement process analyzes the captured signal data in the following sequence:
1. Approximately 500 samples of the waveform (equivalent to one screen width)
are scanned to determine the maximum and minimum sample amplitudes.
2. The difference between the maximum and minimum sample values is calculated
and stored as the Signal Amplitude.
3. The Transition Threshold is computed as one-half the sum of the maximum and
minimum sample amplitudes.
4. The processor locates each crossing of the Transition Threshold.
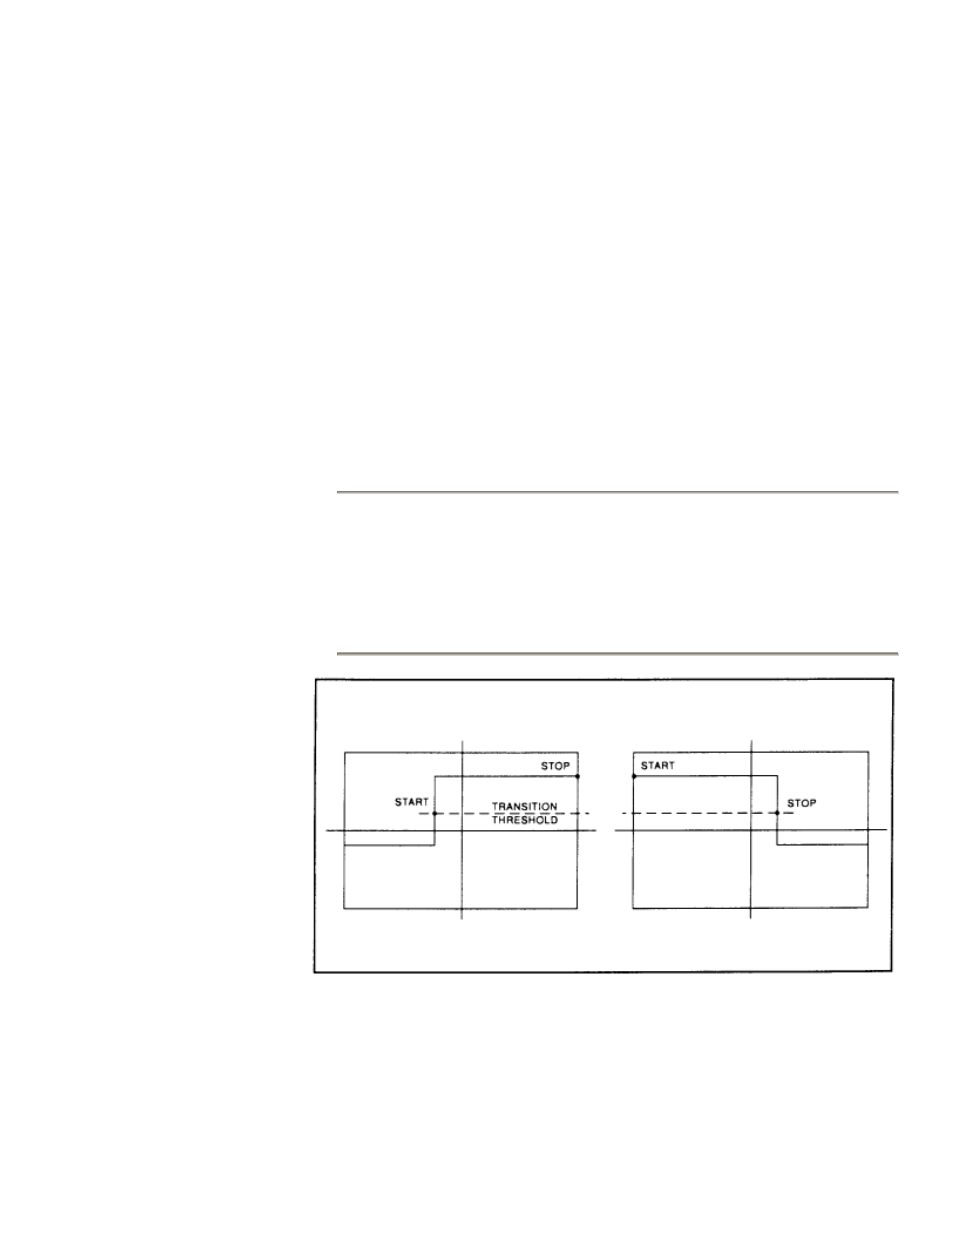
5. Starting at the left edge of the screen, the processor classifies each Transition
threshold crossing according to whether it is positive-going (– +) or negative-
going (+ –). Because the signal is repetitive, only three transitions are needed to
classify the waveform, as follows:
Type Sequence
Description
0
none
No crossings detected
1
Not used
2
+ –
One falling edge
3
– +
One rising edge
4
+ – +
One falling, followed by one rising edge
5
– + –
One rising, followed by one falling edge
6
+ – + –
Two falling edges
7
– + – +
Two rising edges
Figure 6-5.
Step Waveforms
6. If the signal is Type 0, (No crossings detected) no measurements can be
performed and the routine is terminated, pending the next reload of the data
buffers.