Viewing the data graph, Printing from the electronic cam window – Yaskawa FSP Amplifier FlexWorks User Manual
Page 72
Operating the FSP Amplifier Using FlexWorks
72
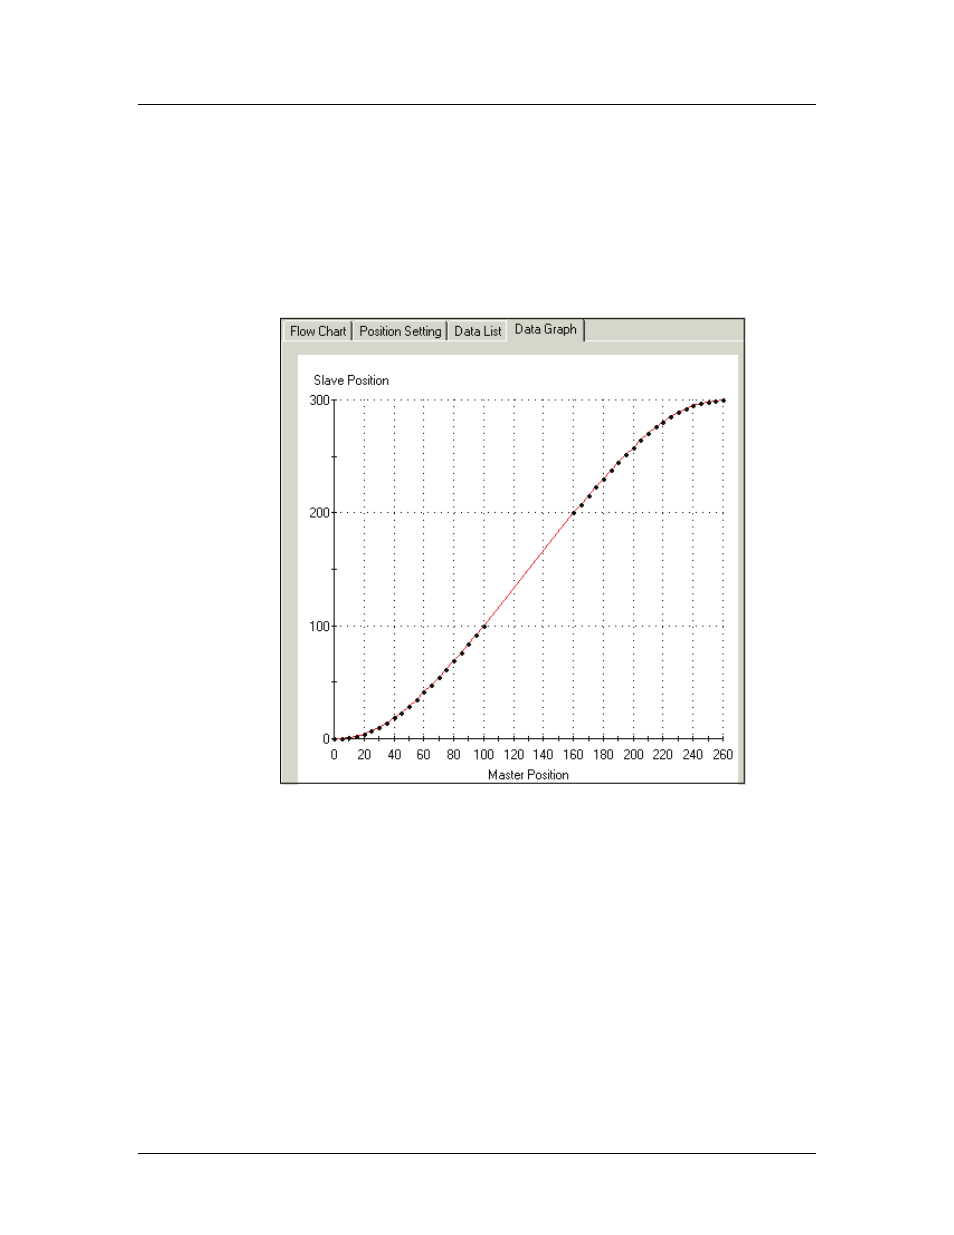
4.9.9. Viewing the Data Graph
The data graph graphically represents the specified table. The dots
along the curve represent the interpolated points.
To view the data graph:
1. Open the Data Graph tab.
0.
The data graph is displayed.
Figure 41: Data Graph
4.9.10. Printing from the Electronic Cam Window
The contents of each of the Position Setting, Data List and Data
Graph tabs can be printed:
To print from the Electronic Cam Window:
1. Select the profile to print from the Profile List.
2. Select the tab to be printed.
3. Click Print.
The Print dialog box is displayed.
4. Make any necessary changes to the settings shown and
click Print.
This manual is related to the following products:
See also other documents in the category Yaskawa Equipment:
- Tag Generator (30 pages)
- MP3300iec (82 pages)
- 1000 Hz High Frequency (18 pages)
- 1000 Series (7 pages)
- PS-A10LB (39 pages)
- iQpump Micro User Manual (300 pages)
- 1000 Series Drive Option - Digital Input (30 pages)
- 1000 Series Drive Option - CANopen (39 pages)
- 1000 Series Drive Option - Analog Monitor (27 pages)
- 1000 Series Drive Option - CANopen Technical Manual (37 pages)
- 1000 Series Drive Option - CC-Link (38 pages)
- 1000 Series Drive Option - CC-Link Technical Manual (36 pages)
- 1000 Series Drive Option - DeviceNet (37 pages)
- 1000 Series Drive Option - DeviceNet Technical Manual (81 pages)
- 1000 Series Drive Option - MECHATROLINK-II (32 pages)
- 1000 Series Drive Option - Digital Output (31 pages)
- 1000 Series Drive Option - MECHATROLINK-II Technical Manual (41 pages)
- 1000 Series Drive Option - Profibus-DP (35 pages)
- AC Drive 1000-Series Option PG-RT3 Motor (36 pages)
- Z1000U HVAC MATRIX Drive Quick Start (378 pages)
- 1000 Series Operator Mounting Kit NEMA Type 4X (20 pages)
- 1000 Series Drive Option - Profibus-DP Technical Manual (44 pages)
- CopyUnitManager (38 pages)
- 1000 Series Option - JVOP-182 Remote LED (58 pages)
- 1000 Series Option - PG-X3 Line Driver (31 pages)
- SI-EN3 Technical Manual (68 pages)
- JVOP-181 USB Copy Unit (2 pages)
- JVOP-181 (22 pages)
- SI-EN3 (54 pages)
- SI-ET3 (49 pages)
- MECHATROLINK-III (35 pages)
- EtherNet/IP (50 pages)
- SI-EM3 (51 pages)
- 1000-Series Option PG-E3 Motor Encoder Feedback (33 pages)
- 1000-Series Option SI-EP3 PROFINET (56 pages)
- PROFINET (62 pages)
- AC Drive 1000-Series Option PG-RT3 Motor (45 pages)
- SI-EP3 PROFINET Technical Manual (53 pages)
- A1000 Drive Option - BACnet MS/TP (48 pages)
- 120 Series I/O Modules (308 pages)
- A1000 12-Pulse (92 pages)
- A1000 Drive Software Technical Manual (16 pages)
- A1000 Quick Start (2 pages)
- JUNMA Series AC SERVOMOTOR (1 page)
- A1000 Option DI-101 120 Vac Digital Input Option (24 pages)