Graph settings, Show, Caption – Yaskawa FSP Amplifier FlexWorks User Manual
Page 52: Chart toolbar, Graph, Settings, Show 4.7.1.4. caption 4.7.1.5. chart, Toolbar
Operating the FSP Amplifier Using FlexWorks
52
4.7.1.2. Graph Settings
For all of the graph settings described below, you can select the
scale (available values are 1, 2, 5, 10, 25, 50, 100, 500, 1000) and
the color in which the results will be displayed.
♦ X – Sampling Time Interval
Specifies the time interval for obtaining trace data (default:
25ms). The total trace time for which results are obtained is the
sampling time interval multiplied by 10.
♦ Y1 / Y2 – Sampled Channel
Available values are:
Target Speed
Smoothed Target Speed
Acceleration
Motor Speed
Position Error
Torque Reference
♦ I/O 1 / I/O 2 – Sampled Digital I/O
Select the sampled output and input signals.
4.7.1.3. Show
Select the objects that will be displayed in the graph.
4.7.1.4. Caption
Enter the caption to be displayed in the graph.
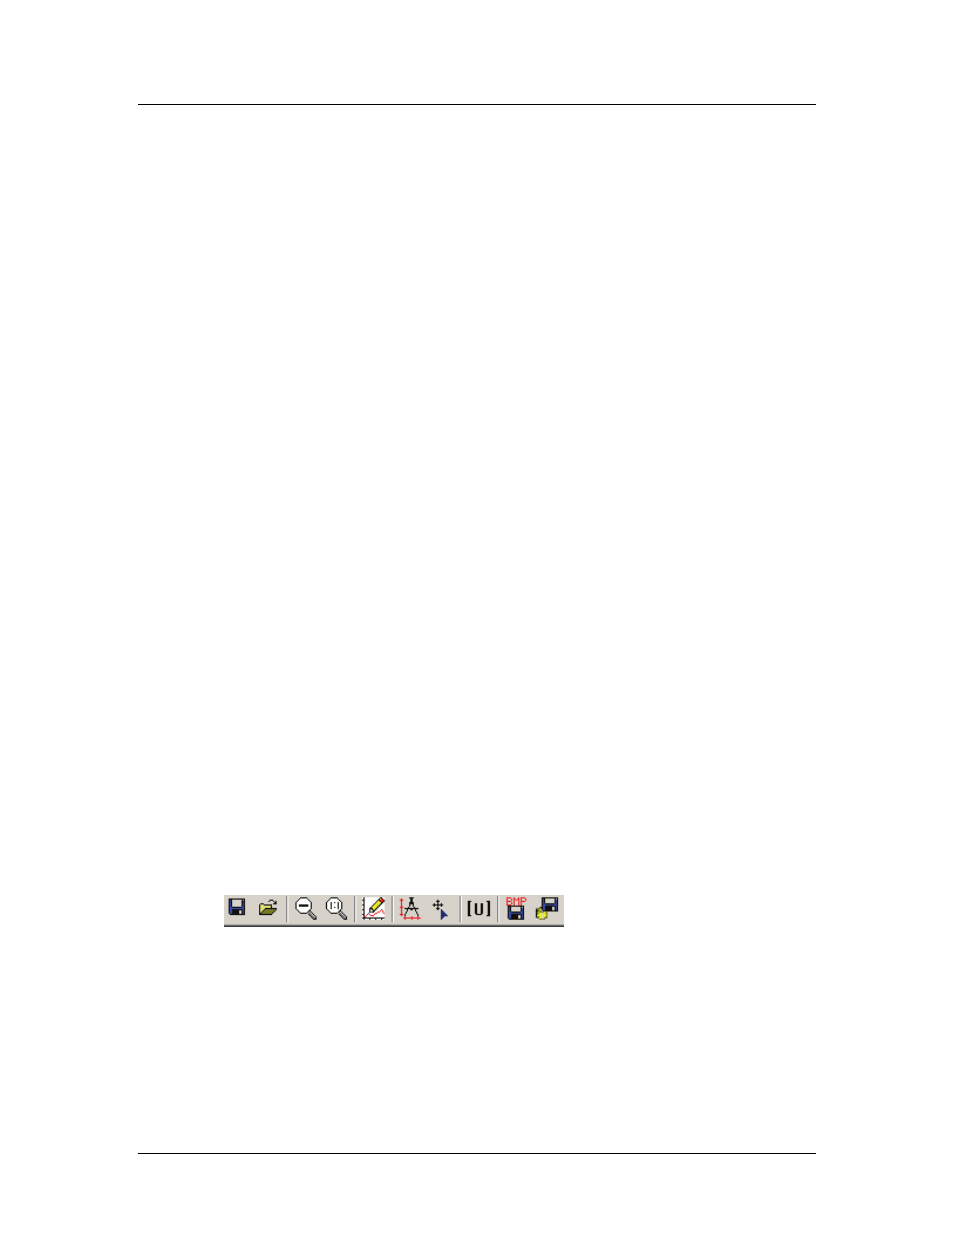
4.7.1.5. Chart Toolbar
The chart toolbar is shown below.
Figure 27: Chart Toolbar
The toolbar icons are explained in the following table.