Mechanical analysis toolbar, Mechanical, Analysis – Yaskawa FSP Amplifier FlexWorks User Manual
Page 59: Toolbar
Operating the FSP Amplifier Using FlexWorks
59
4.8.2. Mechanical Analysis Toolbar
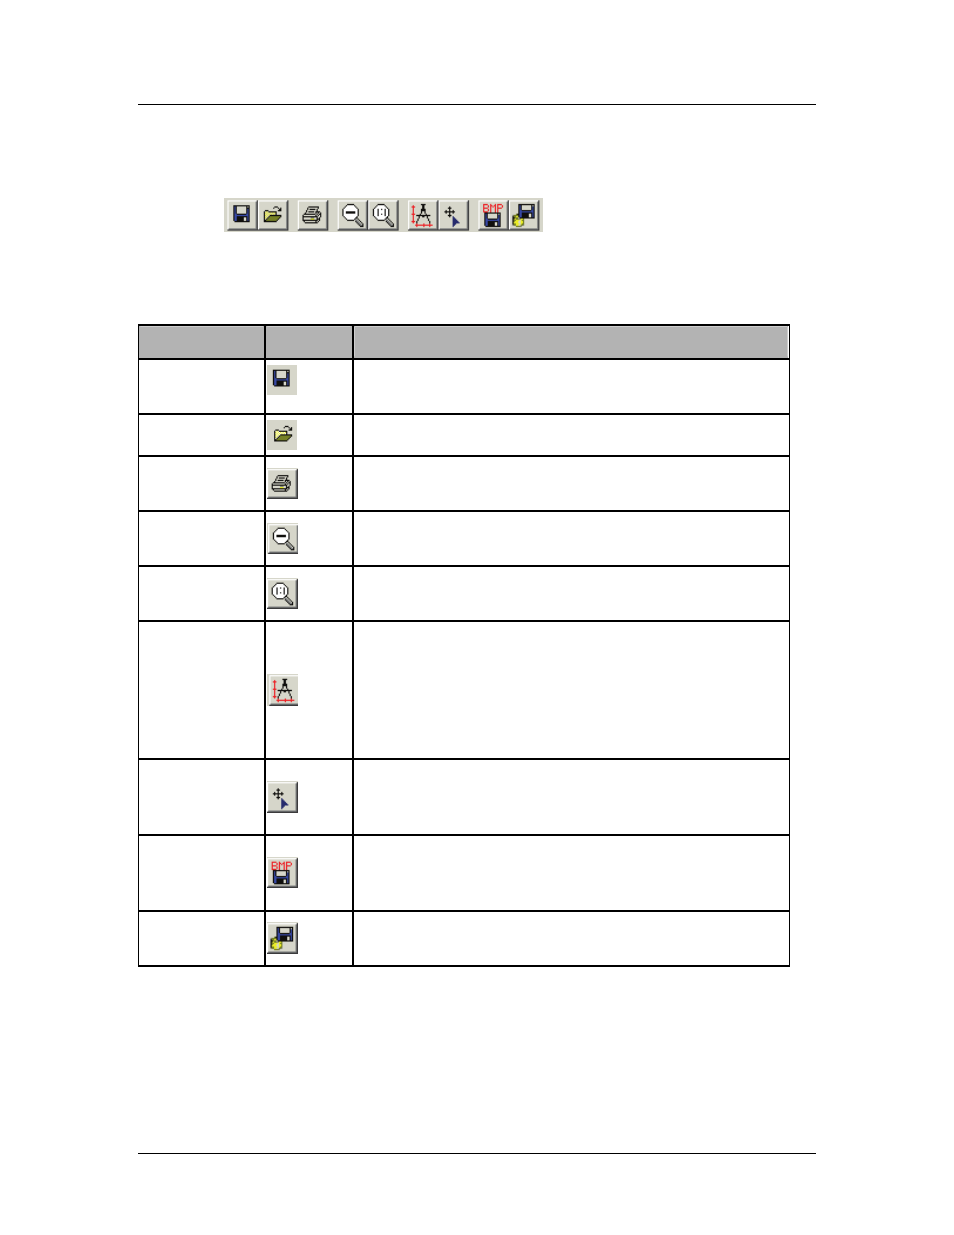
The mechanical analysis toolbar is shown below.
Figure 31: Mechanical Analysis Toolbar
The following table explains the function of each icon:
Table 13: Description of Mechanical Analysis Toolbar Icons
O
PTION
I
CON
D
ESCRIPTION
Save Chart
Saves the current analysis include the settings
and the graph.
Open
Opens a previously saved analysis.
Prints the currently displayed chart and its
corresponding data.
Up One Zoom
Level
Restores the previous zoom level.
Reset Zoom
Restores the area shown in the window to its
normal size.
Enable
Measure
Dragging the cursor by left-clicking the mouse
enables the measurement of the difference
(delta) between the endings of the line. The delta
values are displayed in each axis label. Left-
clicking in a new location starts a new
measurement.
Show Markers
Shows exact value of a point. A yellow cross
reflects the movement of the mouse and the
exact value can be seen in each axis label.
Save Graph
as Picture
Saves graph in bmp format enabling you to view
the graph without the need for the FlexWorks
software.
Export Graph
Data
Saves graph data in Excel format (*.csv).