3 visualization in online mode, Visualization in online mode, Drive plc developer studio – Lenze DDS v2.3 User Manual
Page 38: Program example
Drive PLC Developer Studio
Program example
3-16
l
DDS EN 2.3
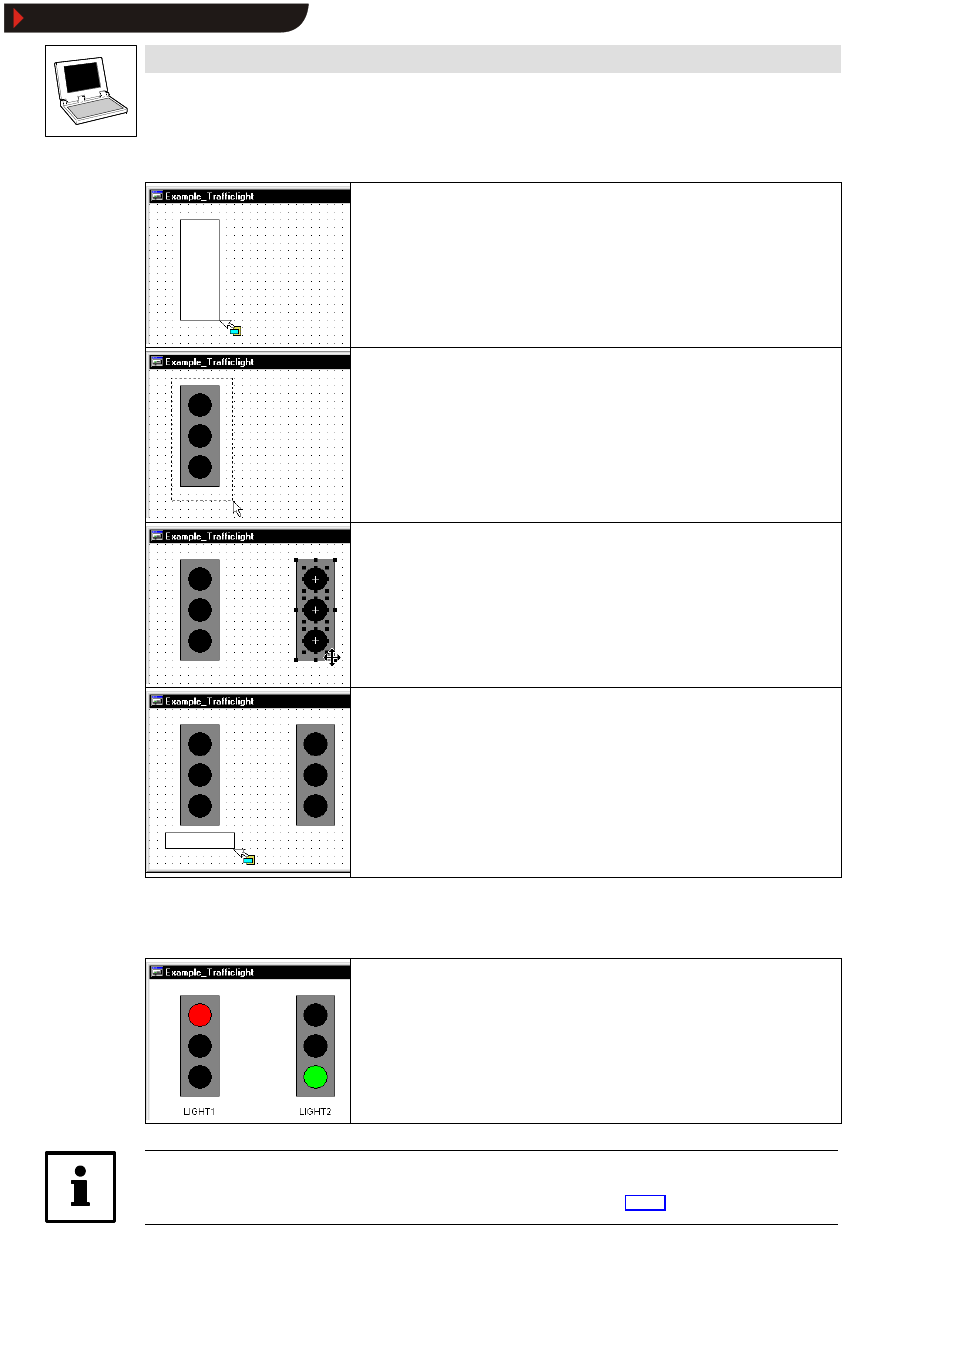
9. Select
InsertWRectangle to draw a rectangle over the three circles.
10.Double-click the rectangle to open the dialog box Configure element .
11.Use the category
Colours to select a dark grey shade for Colour inside (fill colour).
12.Select
ExtrasWTo the background to put the rectangle behind the circles.
13.Use the mouse pointer to draw a frame around the elements to select all elements within the
frame.
14.Copy the selected elements to the clipboard using
15.Insert the copied elements into the drawing using
elements as shown on the left, keeping the left mouse key depressed.
16.Configure the three circles of the traffic light on the right as follows with a double-click:
– Upper circle:
Category
Variables, input field Change colour: PLC_PRG.LIGHT2.RED
– Middle circle:
Category
Variables, input field Change colour: PLC_PRG.LIGHT2.YELLOW
– Bottom circle:
Category
Variables, input field Change colour: PLC_PRG.LIGHT2.GREEN
17.Select
InsertWRectangle to draw a rectangle underneath each traffic light.
18.Configure the rectangles as follows with a double-click:
– Use the category
Colours to select No frame colour.
– Use the category
Text to enter a text for each traffic light
(example: “LIGHT1” and “LIGHT2”).
3.4.3
Visualization in online mode
Restart the program, and the traffic lights will be ”on” in the visualization for the specified times,
and correct functioning of the traffic control system can be very simply tested.
Tip!
For a detailed description of the visualization process refer chapter
Show/Hide Bookmarks