3d plots, Using the 3d plot function – UVP Life Science User Manual
Page 226
LS Software User Guide
212
3D Plots
•
Using the 3D Plot Function
•
Viewpoint Tab
•
Output Tab
The 3D Plots function allows the user to see a three dimensional view of the sample. For example, if two
bands look equally bright in an image, or with naked eye, a 3D plot can actually show if there is a
quantitative difference in intensity. A 3D plot can also be used as a great presentation tool.
The uniformity of the light source in conjunction with the camera response can be checked using 3D
plots.
Using the 3D Plot Function
The 3D plots can be used for static images as well as live preview and integration.
•
Open an image.
•
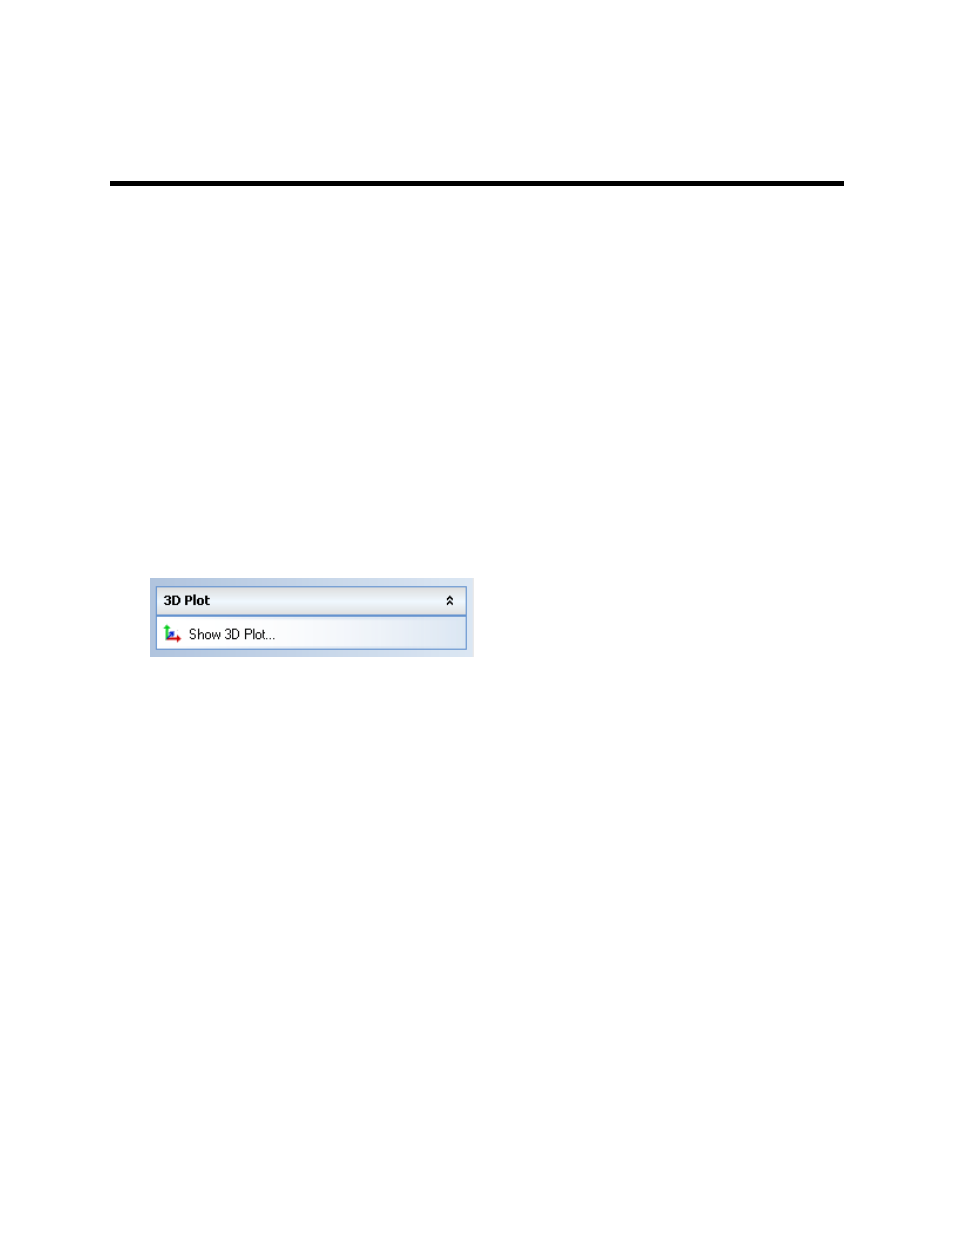
To access the 3D Plot function, click on the
Image Action Tab and then select the Display
Control menu button.
•
This will bring up a separate window that shows the 3D plot.