UVP Life Science User Manual
Page 133
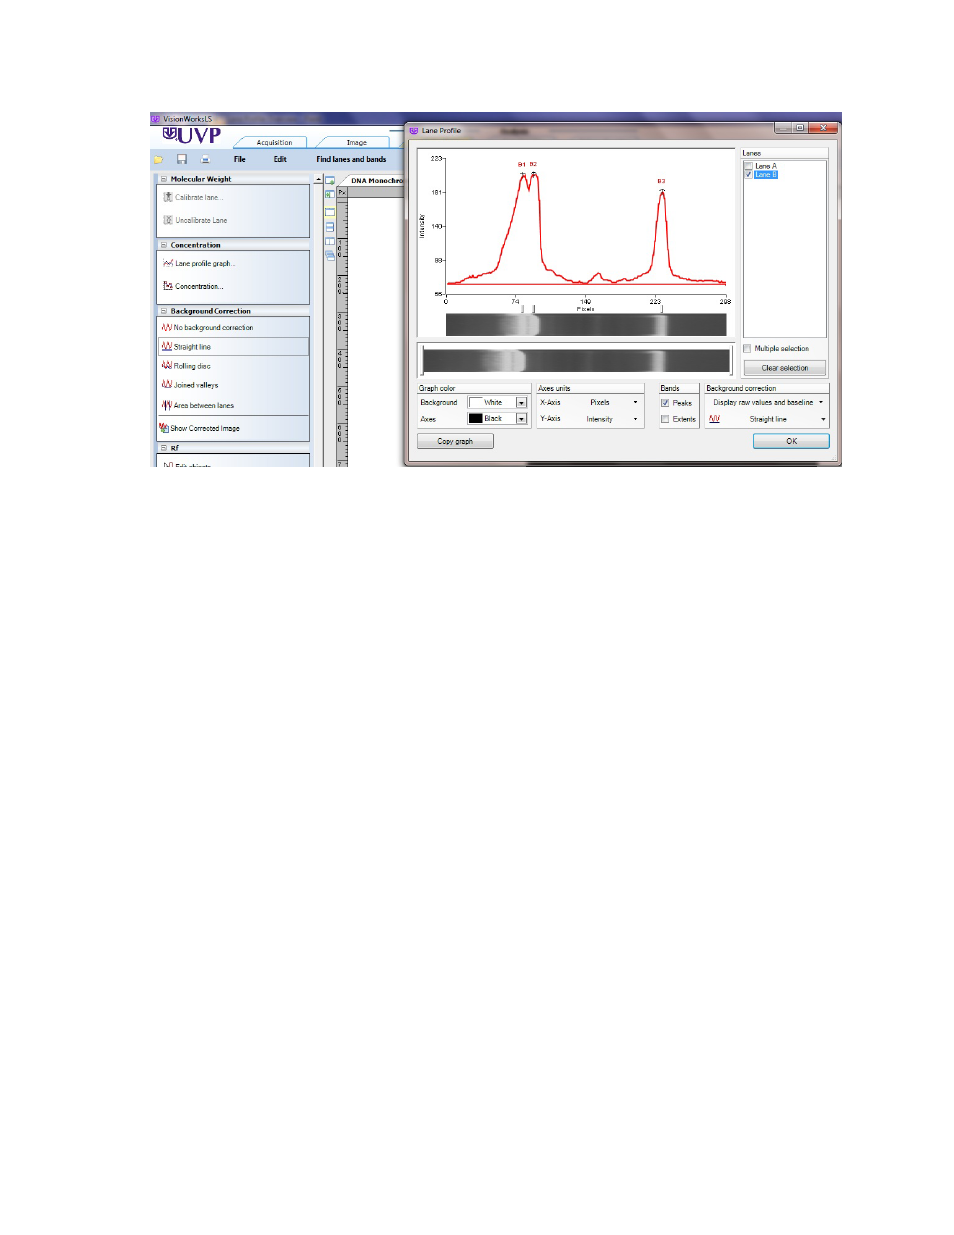
Perform 1D Analysis
119
Note: Straighten lines by using right-clicking the mouse button to open the shortcut menu.
Joined Valleys
Selecting this option accentuates the data by telling the software to join lines between the lowest
point, or "valley", before the first band, between each pair of bands, and after the last band.
Intensities above the valleys (band data) are emphasized. Joined valleys can perform well in a
variable illumination condition where the "bright spot" is somewhere in the middle of the image, and
where bands are sharply defined and quite distinct. Joined Valleys requires a sensitivity value to be
entered. A higher value of sensitivity starts "eating" into the bands, which may not be accurate.
To Use Joined Valleys:
•
Select
1D Analysis > Lane Profile > Background correction options select Joined valleys.
•
A pop-up window appears that allows the user to set a sensitivity value from 0 to 100.
•
Change the size either by typing in the sensitivity value, or by using the up and down arrow signs.
Click
OK after entering the number.