Information found in the 1d analysis image window – UVP Life Science User Manual
Page 115
Perform 1D Analysis
101
Lane Properties also offers the following information:
•
Lane ID
•
Unit Name of Mass
•
Intensity Maximum
•
Intensity Volume
•
Concentration Maximum
•
Concentration Volume
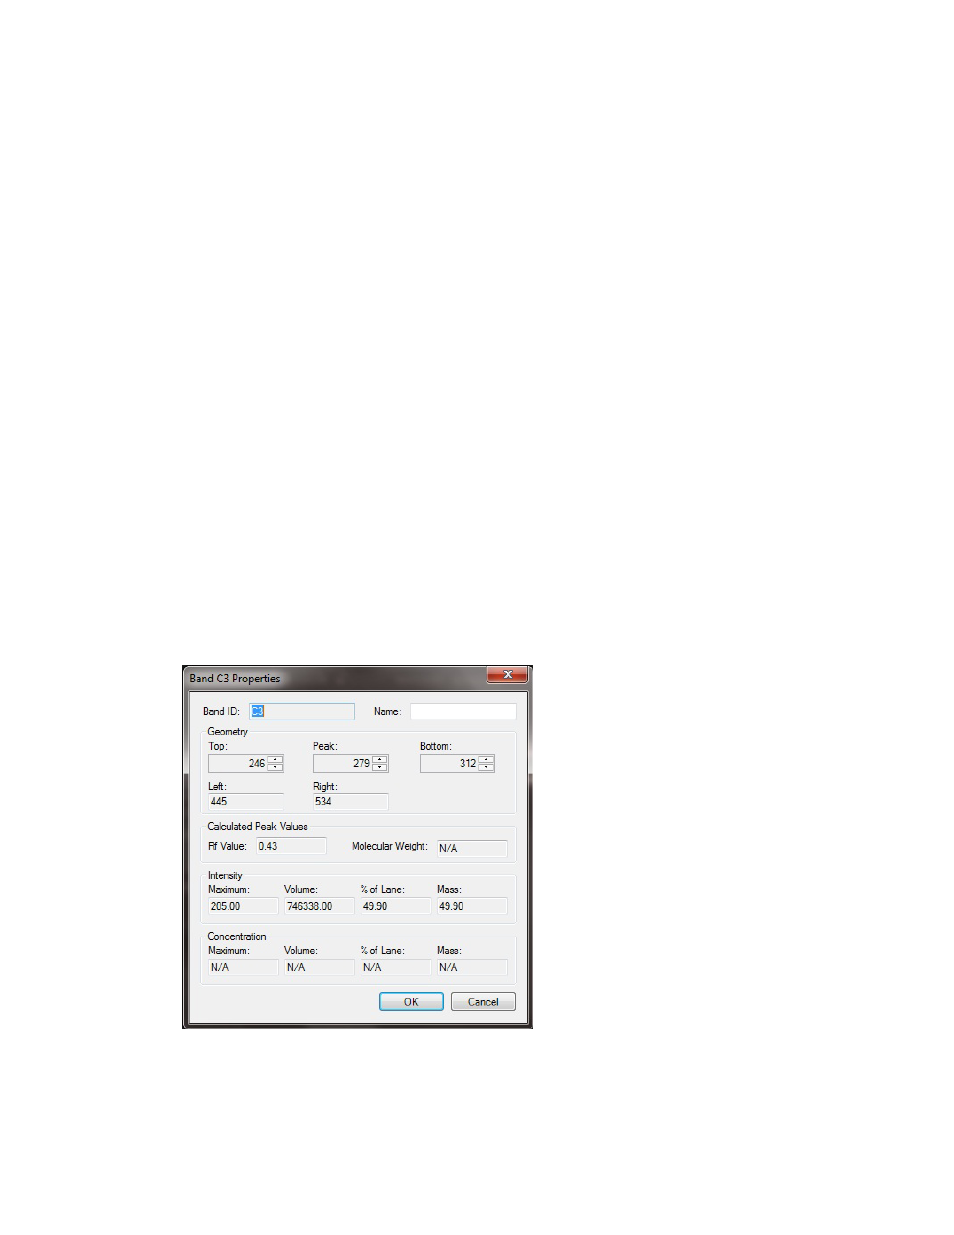
View and Use Band Properties
To select a band, click on a band of interest The band will appear with four red boxes one in each
corner of the selected lane. From the
1D Analysis Action Tab > Edit lanes and bands, select
Object properties. In this window, the software allows users to perform various changes to the lane
including:
•
Name
•
Geometry
•
Band ID
•
Left and Right band positions
•
Calculated Peak Values (Rf value and Molecular Weight)
•
Intensity of the band, including its Maximum, Volume, % of lane, and Mass; and
•
Concentration of the band, including its Maximum, Volume, % of lane, and Mass.
Information Found in the 1D Analysis Image Window