Axis options, Display options – UVP Life Science User Manual
Page 137
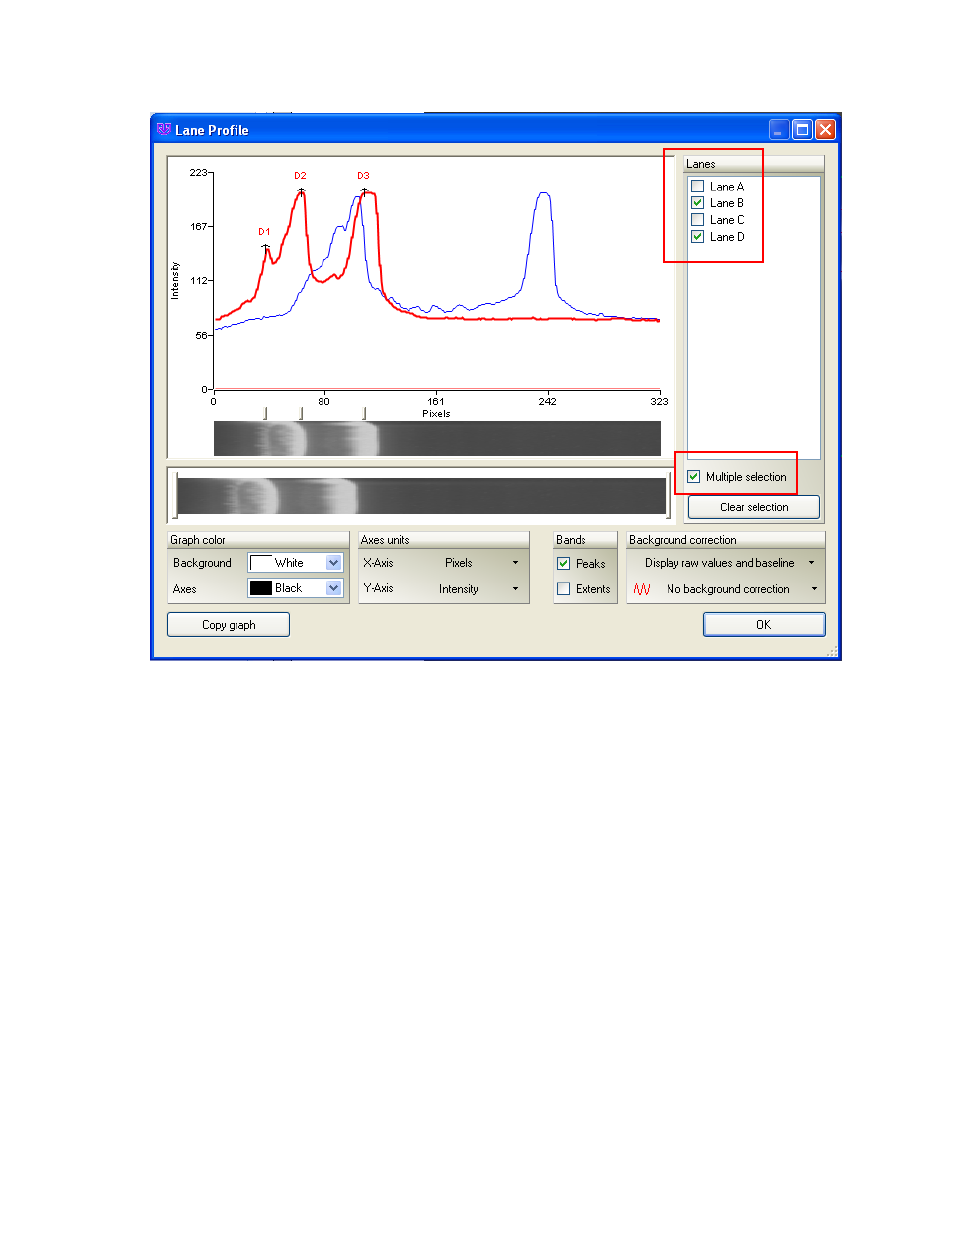
Perform 1D Analysis
123
Axis Options
By default, the x-axis displays
Pixels and the y-axis displays Intensity. However, after calibrating
molecular weight,
Rf values or Molecular Weights (MW Standard) may be a better naming option for the
x-axis. Similarly, after calibrating concentration,
Concentration may be a better naming option for the y-
axis.
Change Axis Units
•
To change axis units after performing either molecular weight calculations or concentration
calibrations, simply go to the
Y Axis and X Axis options under the bottom left of the graph. Use
the drop down menus to select the desired variable.
•
If Retardation factor (Rf) or Molecular Weight (MW) is selected to be displayed on the x-axis, then
the graph takes into account Rf effects. This means that other lanes may appear to be stretched
or compressed horizontally relative to the selected lane.
•
Once Concentration is selected to be displayed on the y-axis, the curve adjusts the intensities of
the lane, and the relative differences in the graph may change.
Display Options
In the Lane Profile graph, the software allows users to choose what details to show in the graph. The
program also allows users to change the colors of the background, graph, and axes.