Histogram controls, Apply a histogram – UVP Life Science User Manual
Page 222
LS Software User Guide
208
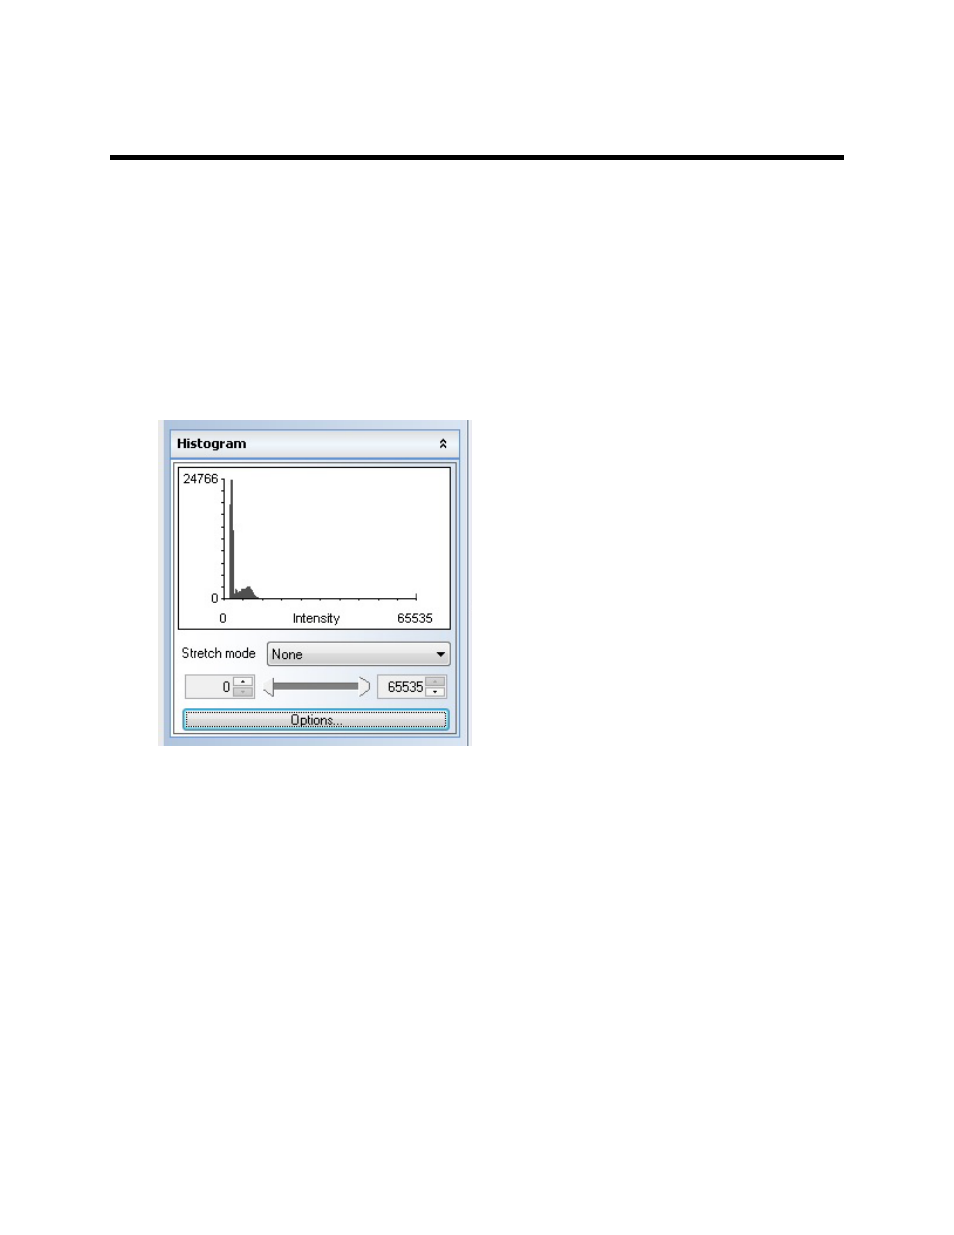
Histogram Controls
The Histogram Controls offer options for viewing tonal and color information about an image. By default,
the histogram displays the tonal range of the entire image. To display histogram data for a portion of the
image, first select that portion.
Note: If an image is modified and opened in a program other than this software, the changes will
not be displayed in that program. To make changes viewable in other programs, use the Flatten
Layers tool. This tool creates a new image with the modifications permanently integrated.
To access the Histogram functions, click on the
Image Action Tab and then select the Display Control
menu button.
Apply a Histogram
•
From the
stretch mode drop-down list, select None, Automatic or Manual.
•
Use the sliders or the up and down arrows to adjust the histogram values. Adjusting these values
will change the stretch mode to
Manual.
Note: Adjusting the main slider bars will open a separate slider to allow for fine-tuning of the
histogram adjustment. Moving the fine-tune slider to either end will cause the intensity number to
move rapidly. To slow down the adjustment, move the fine-tune slider towards the center of the
bar.