1d analysis settings – UVP Life Science User Manual
Page 153
Perform 1D Analysis
139
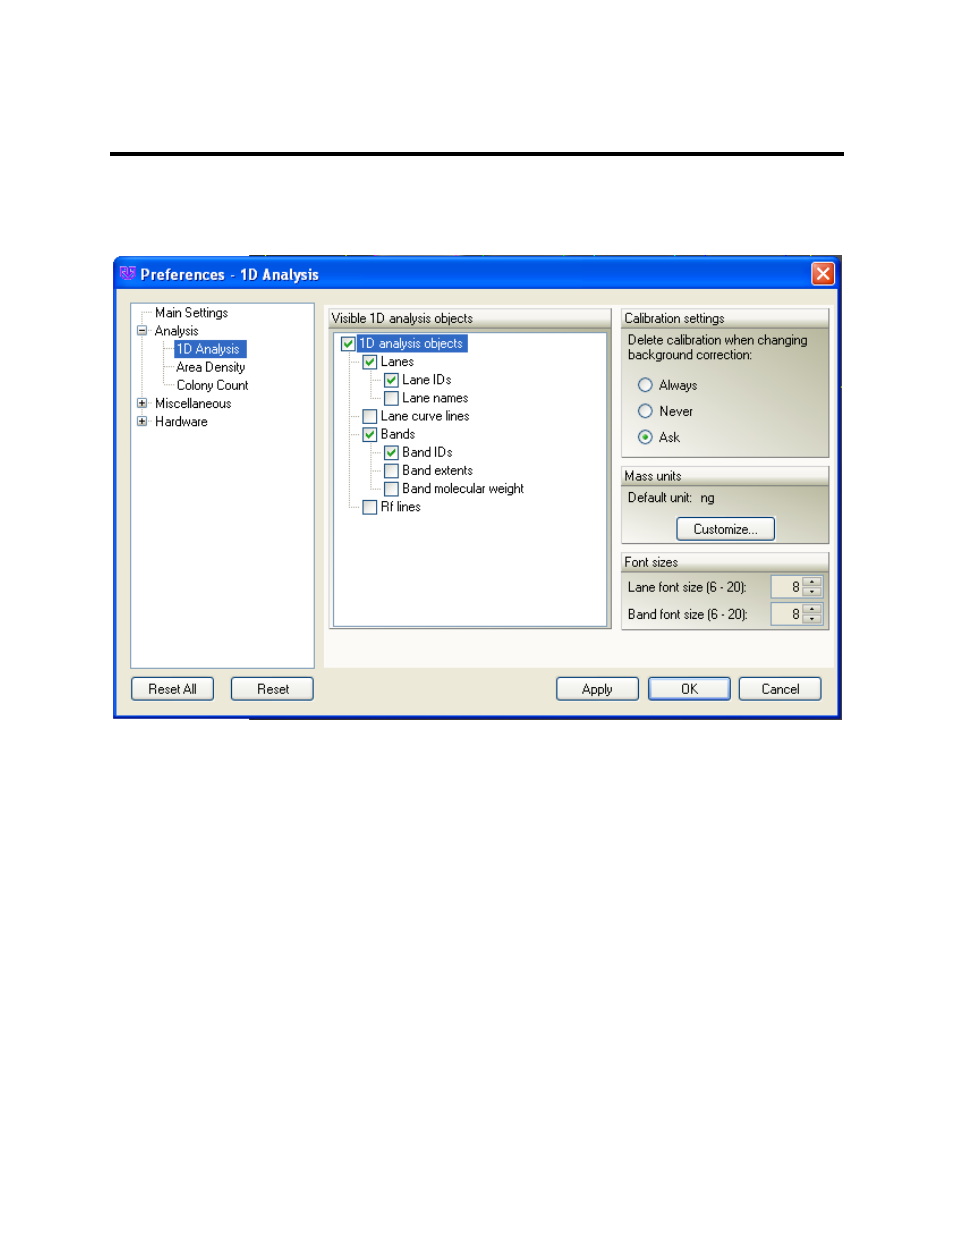
1D Analysis Settings
To access analysis
Preference settings, go to the 1D Analysis Action Tab, click on the Settings menu
button and click Additional settings.
Note: Some settings can accessed by clicking on 1D Analysis Action Tab and clicking on the Find
Lanes and Bands menu button.
•
Visible 1D analysis objects: Allows users to view specified values in the Image Window such as
Lane ID's, Lane Name, Lane Curve Lines, Band ID's, Band Extents, Band Molecular Weights,
and RF Lines.
•
Calibration settings: At the request of the user, deletes calibration when changing background
correction.
•
Mass Units: This feature is for concentration units. The unit of mass that appears is "ng"
(nanograms). Note that by clicking
Customize, users may add additional units. Mass units are
weight numbers, relative units or any relational units defined by the user.
•
Font size: By clicking the buttons for Lane Font Size and Band Font Size, font size can be
changed for the Lane ID, Lane Name and Band ID labels. The font range is from 6 - 20.
In the
1D Analysis Action Tab in the Find Lanes and Bands menu under Settings, are the following
options: