View – Measurement Computing TempScan/1100 User Manual
Page 154
CV-22 ChartView
988992
Software
Reference
Display config.
Allows you to: Open a previously saved display configuration file, save the
current display configuration file, or save the current display configuration
file in a different location (or under a different file name). (See following
note).
Note:
There will be no default Display Configuration file present the first time
ChartView is started. In this case, Chart Setup Wizard activates, allowing
you to create a display setup. When ChartView is shutdown, the display
configuration is automatically saved in a default configuration file that will
load upon the next startup of ChartView.
If the default display configuration becomes corrupt, or if you would like to
bypass this configuration when starting ChartView, you can hold down the
Control Key when starting ChartView. This causes the program to ignore the
default display configuration and await your creation of a new display.
Start F5
Stop F6
Pause F7
Starts, stops, or pauses chart scrolling.
Next Group Ctrl+G
Selects the next chart group in the display configuration.
Faster Ctrl+Z
Slower Ctrl+X
Used to alter the chart scrolling speed. There are fourteen possible chart
speeds. The range of speeds is from 0.1 sec/div to 1.0 hr/div.
Zoom
[ Restore ]
Zoom causes the Main Window to display one chart only. For example, if
you were viewing 3 charts and desired to get a better view of Chart 2, you
could use Zoom to view Chart 2 using the full chart viewing area, as
compared to using one third of the area. The zoom feature can also be
invoked by double-clicking in the chart region of the chart you want to apply
the zoom to.
Once you have zoomed in on a chart, the pull-down menu Zoom option is
replaced by a Restore option. Selecting Restore from the menu will return
the main window to its previous multiple chart viewing status. The restore
feature can also be invoked by again double-clicking in the chart region.
Grid limit lines
Off Ctrl+F1
Solid Ctrl+F2
Dots Ctrl+F3
Allows you to turn the chart’s grid limit lines (items 13 & 19) on or off. If
“on”, you can have the grid lines appear as solid or dots.
Timestamp
Absolute Ctrl+F4
Relative Ctrl+F5
Allows you to select an Absolute or Relative style of timestamp.
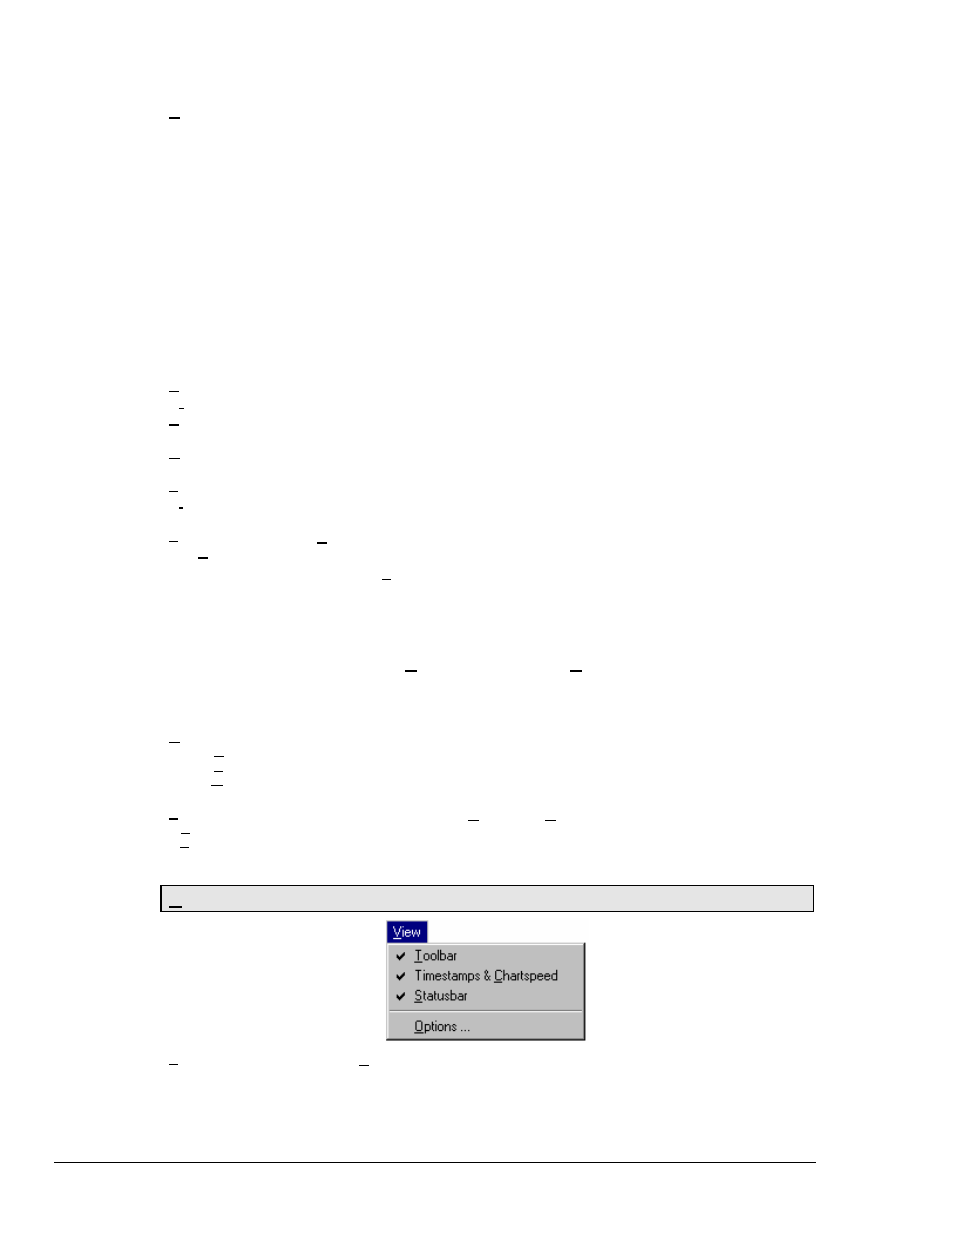
View
Toolbar
A 9 by Toolbar indicates the toolbar will be visible. The absence of the 9
indicates the visible toolbar option is not chosen, and in this case will not
appear on the Main Window. Use the mouse to select or de-select the toolbar
option.