Status indicator region – Measurement Computing TempScan/1100 User Manual
Page 139
Software Reference
988992
ChartView , CV-7
Units/div - The units in units/div (18) can be °C, °F, °K, °R, mV, or V. The division referenced is
one vertical grid. In the example above for Channel 1, each vertical grid increment represents 10.58°C
per division. Changing the units/division spinner controls will result in an automatic adjustment of the
max scale and min scale values (items 13 and 19). Aside from using the units/div triangular controls
to change the value, you can change units/div by placing the mouse cursor in (or tabbing over to) the
field and then either typing in the desired value, or using the PC keyboard arrow control keys.
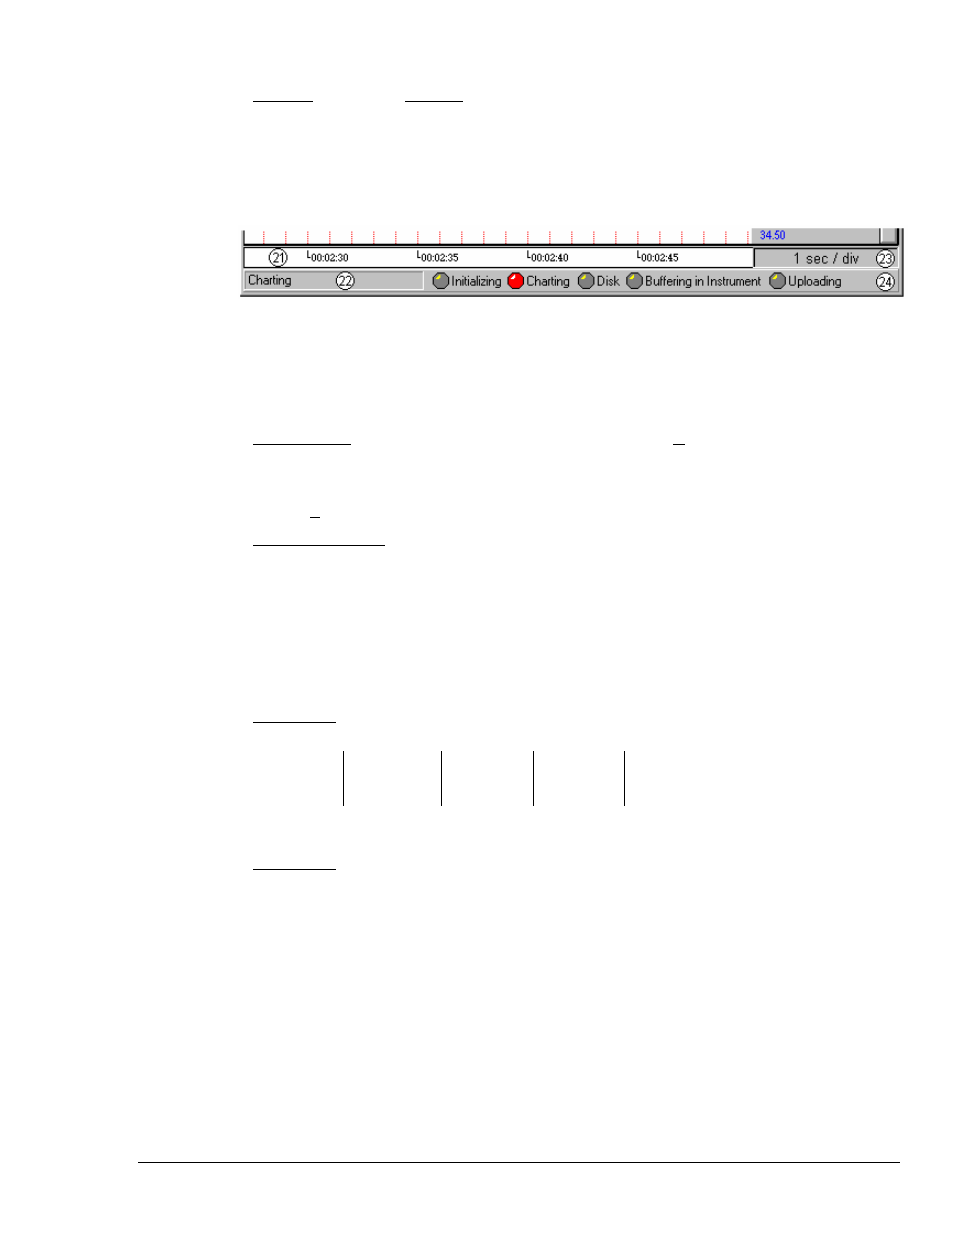
Status Indicator Region
The status indicator region of the Main Window, located along the bottom of the window, consists of
the following items:
21 Scrolling Time
23 Chart Speed (Time/Div)
22 Status Message Box
24 Status LEDs
1
Scrolling Time - Scrolling Time (21) is turned On or Off from the View pull-down menu. Time
Stamp can be “absolute” (real time) or “relative.” Absolute time is based on your computer clock,
whereas relative time starts at 00:00:00 hours/minutes/seconds, and then continues timing in
increments relative to the Chart Speed (23). The Absolute or Relative time stamp style is selected
from the Chart pull-down file.
Status Message Box - The Status Message Box (22) informs you of the status of the data acquisition
device. Several sample messages appear below:
Sample Status Messages
Attaching to device …
Trigger device. Setting acquisition parameters.
Setting channel configuration …
Acquisition active. Updating active.
Setting the acquisition parameters.
Acquisition active. No updating.
Charting …
Waiting for trigger …
Chart Speed - Chart Speed (23) consists of a “time per division” value that can be changed using the
“faster” (rabbit) button or “slower” (turtle) button. Fourteen possible chart speeds are as follows:
0.1 sec/div
1 sec/div
10 sec/div
2 min/div
30 min/div
0.2 sec/div
2 sec/div
30 sec/div
5 min/div
1 hr/div
0.5 sec/div
5 sec/div
1 min/div
10 min/div
Status LEDs
1
- ChartView’s Main Window contains five virtual LEDs (item 24) for conveying the
state of the system. Each of the five indicators is labeled on the main window. These indicators are:
Initializing:
Indicates ChartView is configuring the data acquisition instrument.
Charting:
Indicates charting is in progress. This indicator is useful when charts are scrolling at a very slow
speed.
Disk:
Indicates ChartView is writing to disk.
Buffering in
Instrument:
Indicates the data acquisition instrument is storing scans that are not being saved to disk.
Uploading:
Indicates data in the instrument is being uploaded to the PC.