Measurement Computing TempScan/1100 User Manual
Page 14
QS-4 TempScan / MultiScan Quick Start Guide
988892
446-0940,
rev
2.2
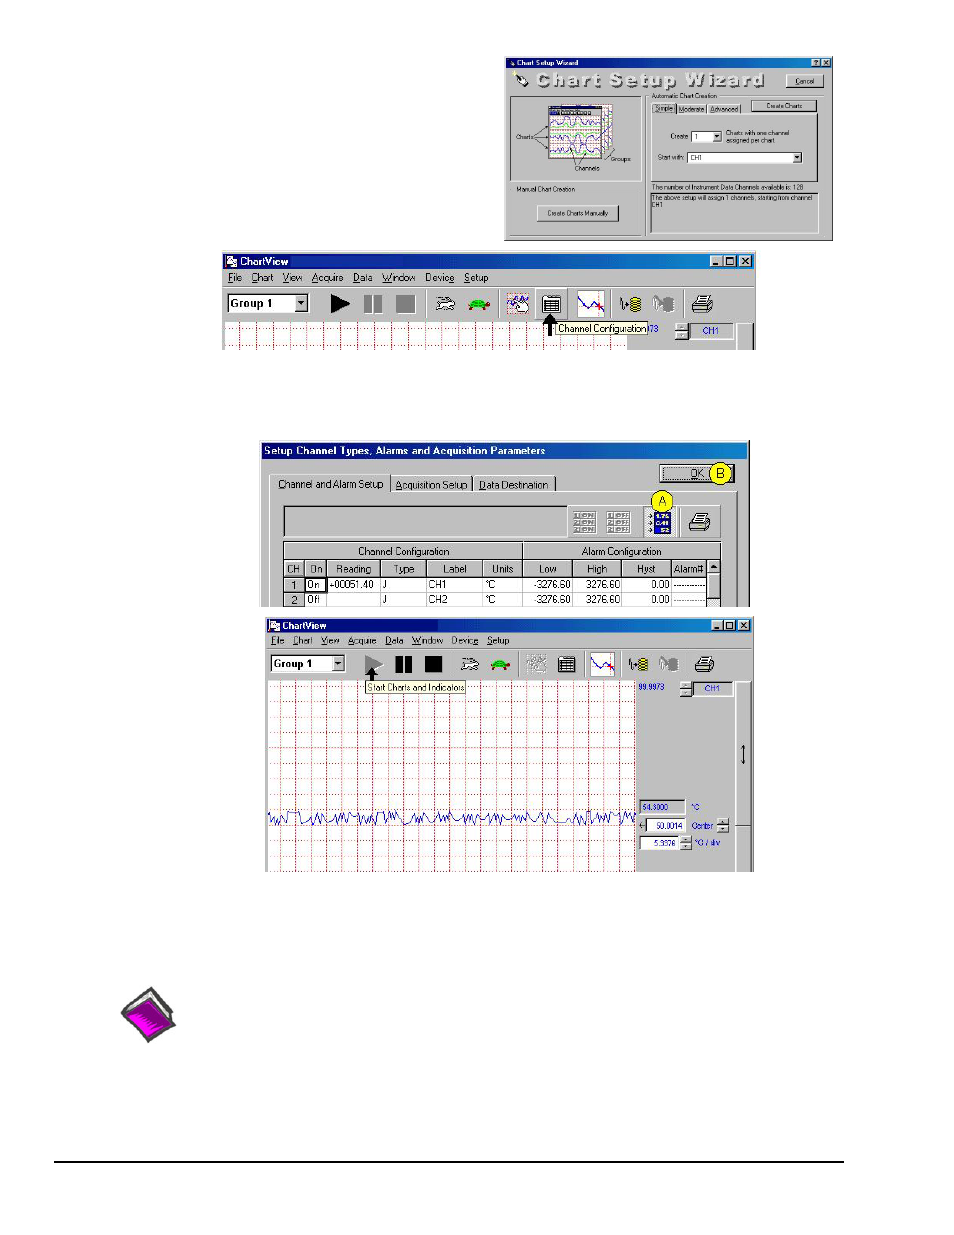
5. In the Automatic Chart Creation portion of the Chart Setup
Wizard box, click the <Create Charts> button. ChartView’s
main window opens. Here we are using the program default
settings. Note that you can go back later and edit the chart setup.
6. In ChartView’s toolbar, click the <Channel Configuration>
button (first figure, following page).
The “Setup Channel Types, Alarms and Acquisition Parameters”
window will open.
7. In the “Setup Channel Types, Alarms and Acquisition Parameters” window (following figure), perform the following
actions: Click the <Turn On/Off Channel Readings> button (item “A”). This activates the Reading column.
Click the <OK> button (item “B”). This accepts the settings. After clicking
open.
ChartView Main Window (Partial View)
8. To start the chart scrolling click on the <Start Charts and Indicators> (
Black Triangle
) button. To stop the chart scrolling
click on the <Stop Charts> (
Black Square
) button. Feel free to continue exploring ChartView to become more familiar
with the application.
Reference Note:
For detailed information regarding ChartView and the post-acquisition data viewer program,
e.g., PostView, refer to the Adobe PDF version documentation. The default location of the electronic
documents is the Programs group, accessible from the Windows Desktop Start menu.
Documents can also be accessed directly from the data acquisition CD via the <View PDFs>
button on the CD’s opening screen.