Summary, System reporter filter dialog, Summary system reporter filter dialog – HP 3PAR Operating System Software User Manual
Page 442

button to specify the logical disks to include. If you have selected specific logical disks,
the Selected radio button is automatically selected. For information on how to select logical
disks, see
“System Reporter Filter Dialog” (page 442)
.
d.
In the Group Values group box, select the attributes you want to use to group chart values.
At least one group type must be selected.
You can group chart reports by one or more of the following attributes: LD Name (default),
Domain Name, CPG Name, and Node.
e.
In the Show Charts group box, select the checkboxes for one or more charts to display:
IOPs, Bandwidth, Service Time, I/O Size, Queue Length, and Average Busy. At least one
chart type must be selected. The default charts are IOPs, Bandwidth, and Service Time.
6.
Click Next to go to the Summary page, or click Finish to complete the wizard.
Summary
Review your settings, then click Finish to complete the wizard.
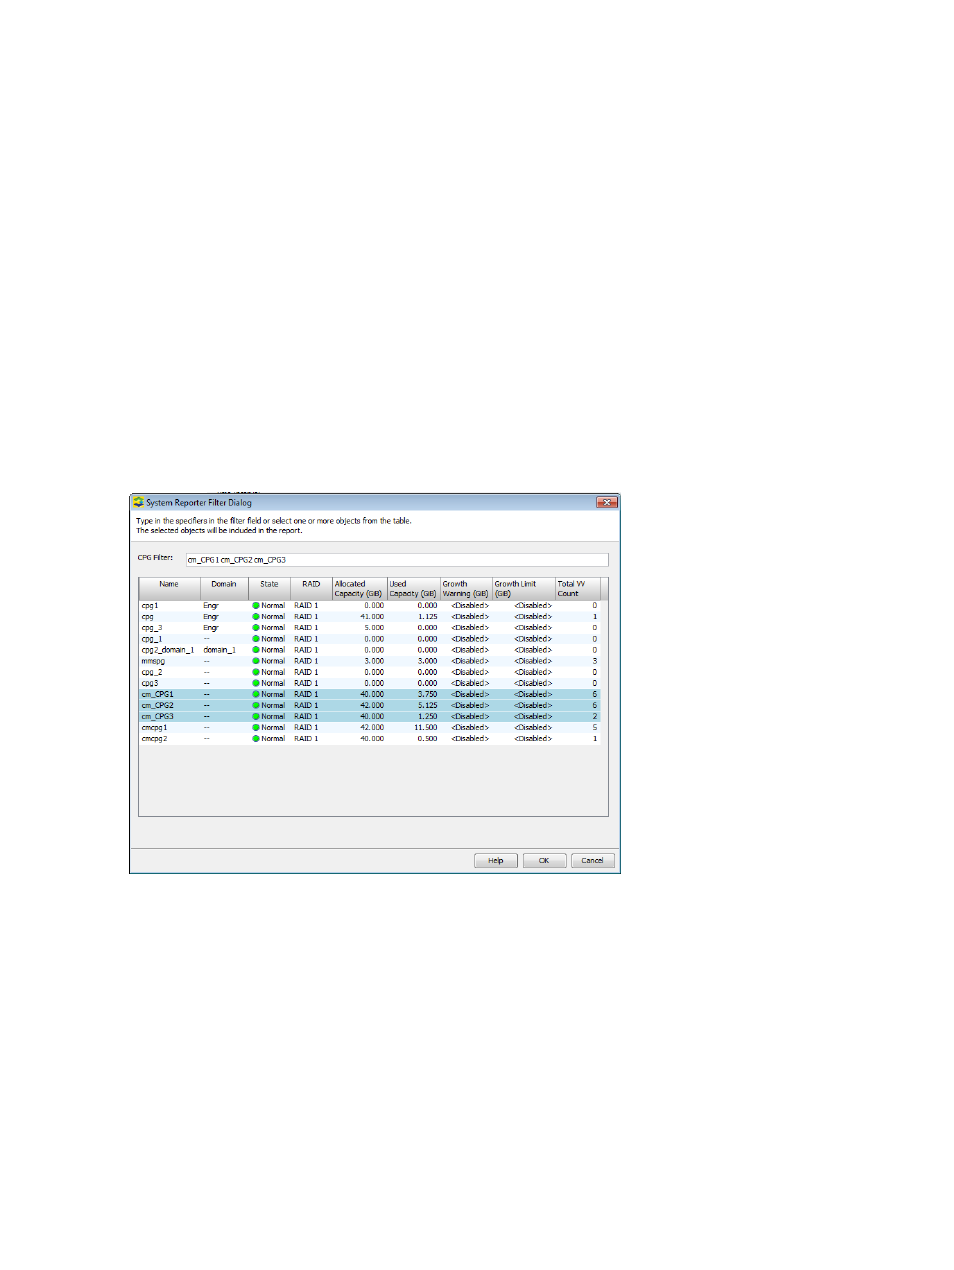
System Reporter Filter Dialog
When you select the Filter radio button on the Object Selection page of the Create New Report
Wizard, then click the Select Objects button, the System Reporter Filter Dialog appears.
To filter objects:
1.
Select one or more objects from the list in the window. (For information on selecting multiple
items, see
“Selecting Multiple Items” (page 505)
).
2.
Click OK to return to the Object Selection page.
442 Tracking Performance
