HP 3PAR Operating System Software User Manual
Page 392

3.
Select a Sampling Resolution:
•
High (Every 5 minutes) – The report is created by using a 5-minute sampling interval.
•
Medium (Hourly) – The report is created using hourly data stored in a database within
the storage system.
•
Low (Daily) – The report is created using daily data stored in a database within the storage
system.
4.
For a Values over a Time Interval chart type:
a.
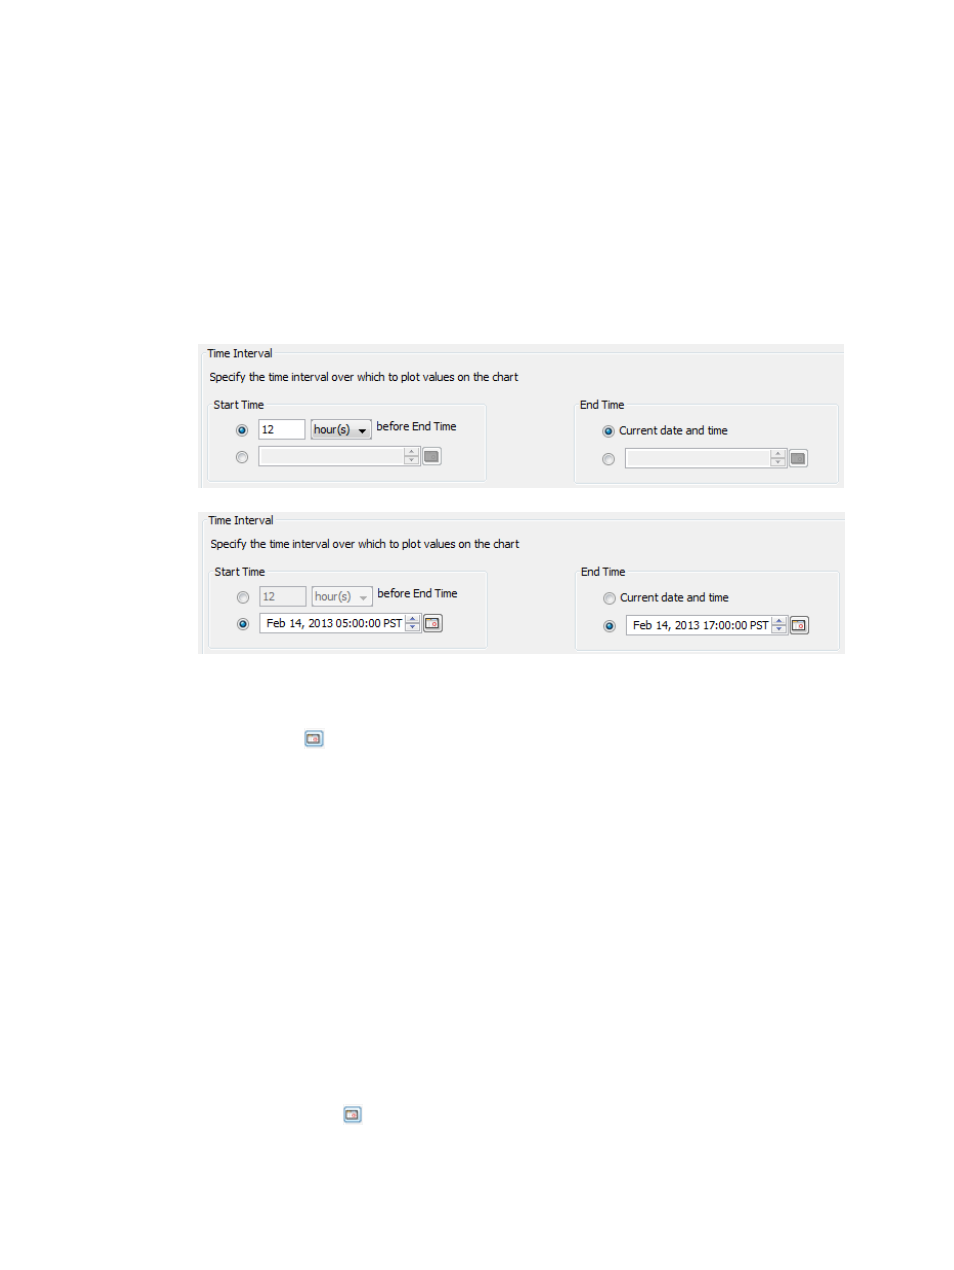
In the Time Interval group box, select a Start Time and End Time. If you keep the default
end time as the current date and time, you can select the start time to be a specific number
of hours prior to the end time. You also have the option to select a specific date and time
for both the start and end times.
To create your own start and end times:
a.
Select the radio button to the left of the Start Time text box.
b.
Click the
icon, and select a date.
c.
To change the displayed date or time, click on any portion of the date or time, then
click the up or down arrow.
d.
Repeat the above steps for setting a specific end time.
b.
In the Show Charts group box, select the checkboxes for one or more charts to display:
IO Time and IO Size. At least one chart type must be selected.
c.
In the Display Metric group box, select how you want to display the access count: Number
or Percentage.
d.
Select how you want to display read/write requests: Combined read/write, Separate
read, or Separate write.
e.
Select the range for the I/O Time Columns: 0.008 to 32768 milliseconds. The default
range is 0.50 ms to 256 ms.
f.
Select the range for the number of I/O operations (I/O Size Columns): 512 bytes to 16
megabytes. The default range is 4k to 1m.
5.
For a Values at a Specified Time chart type:
a.
In the Point in Time or Date and Time group box, select the Current date and time radio
button, or click the
icon to select a date and time. If you have selected a specific date
and time, the Selected date and time radio button is automatically selected.
392 Tracking Performance
