Summary, Creating a vluns report – HP 3PAR Operating System Software User Manual
Page 398
Summary
Review your settings, then click Finish to complete the wizard.
Creating a VLUNs Report
Using the Create New Report wizard, you can generate a report for the following types of data:
•
IO Time and Size Distribution – Shows the I/O access rate and distribution of data for a
specific physical disk.
•
Performance Statistics – Displays historical performance data.
Once you select the type of report you want to generate, a default report Name and Description
appears to the right side of the page. You can keep the default text or provide your own.
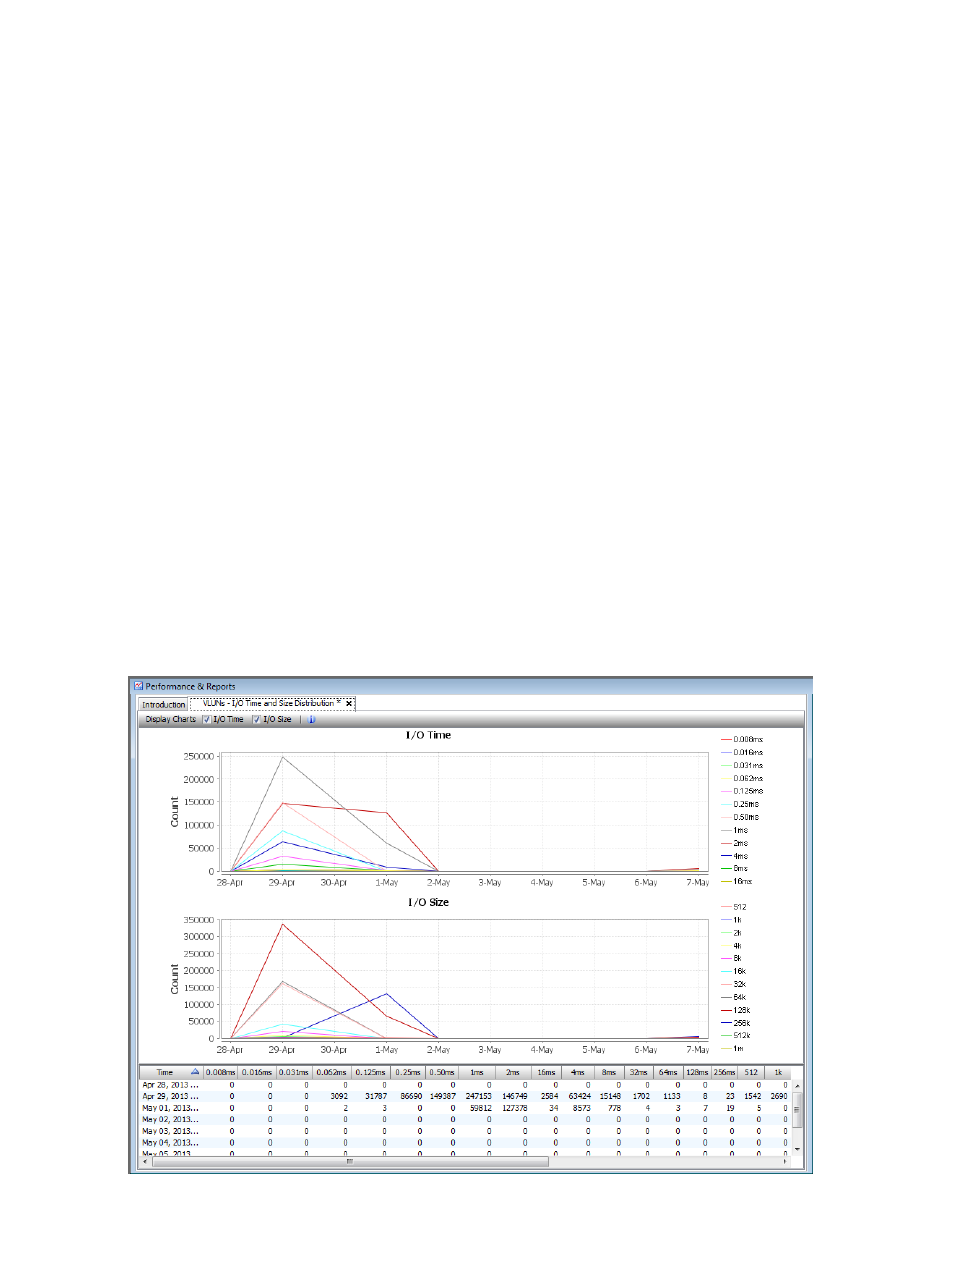
Creating a VLUNs IO Time and Size Distribution Report
The VLUNs IO Time and Size Distribution report displays two charts: I/O Time and I/O Size for
access counts over a time interval or at a specified time.
The I/O Time report displays the read, write, or combined read and write access count for service
times within the specified interval. Each service time is shown in a different color on the same chart.
The X-axis (category) represents time, and the Y-axis (value) indicates the access count.
The I/O Size report displays the read, write, or combined read and write access count for the I/O
sizes within the selected range. Each I/O size is shown in a different color on the same chart. The
X-axis (category) represents time, and the Y-axis (value) indicates the access count.
A table below the charts lists the access count for services times and I/O sizes at time increments
within the selected time interval. For values at a specified time chart types, the table may also
contain the host name, domain name, virtual volume name, LUN, port node, port, slot, and port
number.
VLUNs I/O Time and I/O Size report for values over a time interval:
398 Tracking Performance