Yokogawa Touch Screen GP20 User Manual
Page 278
3-26
IM 04L51B01-01EN
Bar Graph
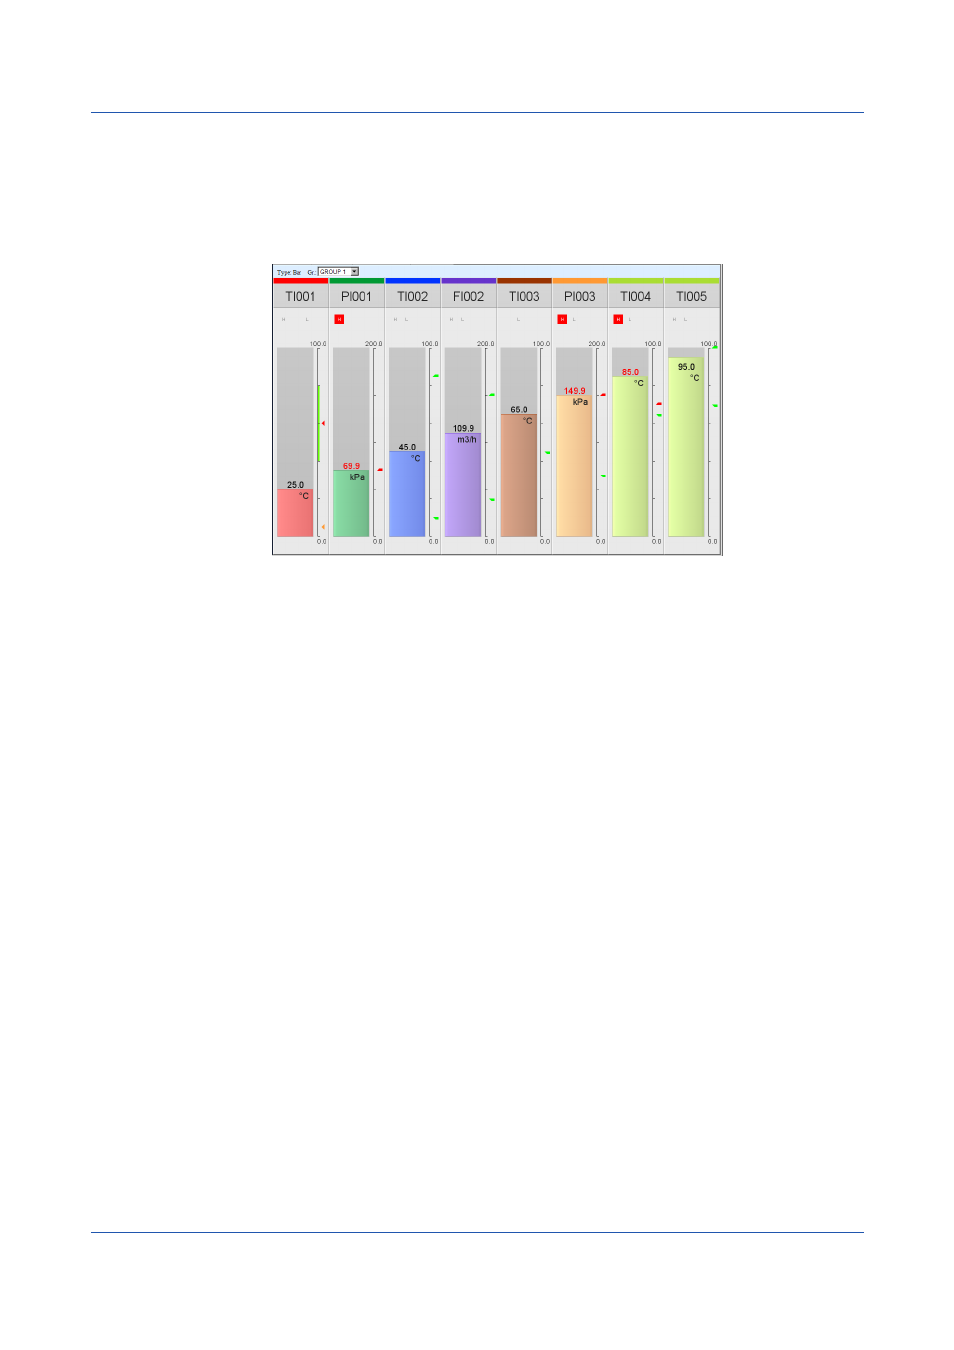
The description of a bar graph screen that can be displayed in one of the divided areas is
given below.
The bar graph is shown vertically, and the starting point of bars is at the bottom. Of the span
lower limit and span upper limit (or scale lower limit and scale upper limit), the smaller value
is displayed at the bottom of the scale, and the larger value is displayed at the top of the
scale.
Alarm Marks
See “Digital.”
When Information Cannot Be Read
Due to space limitations, channel information may not be displayed. If you place the pointer
in a channel area and leave it there for about 1 second, the channel name, digital value, and
unit will appear in a pop-up window.
3.1 Using a Web Browser to Change the GX/GP Settings, Monitor Data, and Control the GX/GP (Web server function)