Yokogawa Touch Screen GP20 User Manual
Page 275
3-23
IM 04L51B01-01EN
Using Network Functions (Ethernet interface)
1
2
3
4
5
App
Displaying Trends’ Past Data
You can display past data as a trend. This is called historical trend.
Data and Interval That Can Be Displayed as a Historical Trend
The current recording and past recording data can be displayed as historical trends over the
following interval.
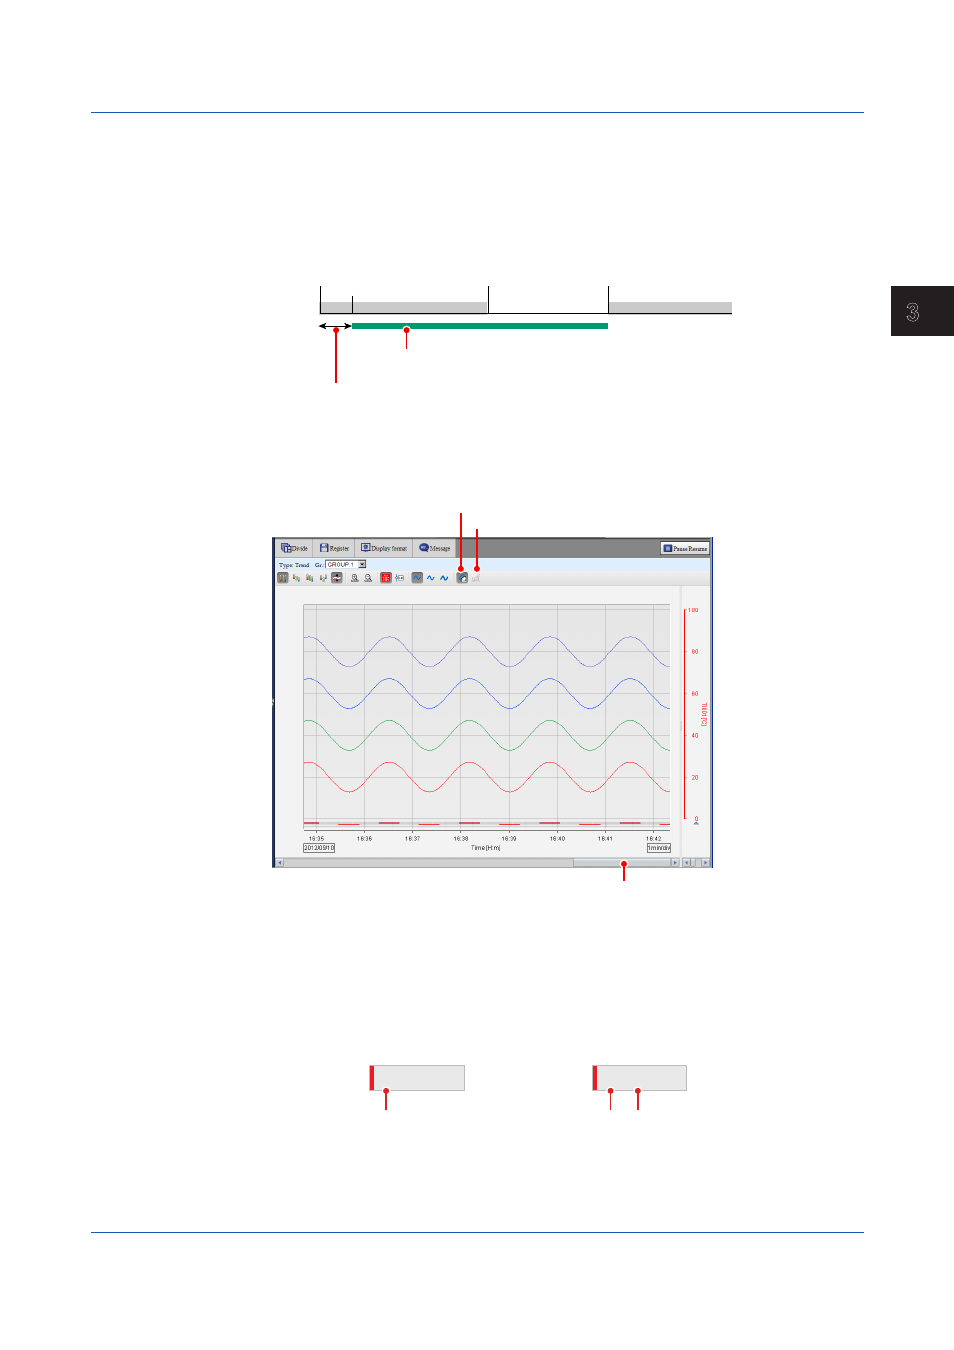
Interval: From the point when 3600 points of data is recorded since the start of recording
until the start of the next recording.
Recording duration A
The next recording duration B
Recording start
Recording stop
Recording start
Duration for which the historical trend of
recording duration A can be displayed
Interval until 3600 points are recorded
Displaying the Historical Trend
Click the historical trend icon to display the historical trend. You can use the scroll bar to
adjust the display range.
Historical trend
Scroll bar
Retrieve historical trend data
You can carry out the following operations. The procedures are the same as those for the
trend display.
• Change the active waveform
• Change the waveform display zone and waveform display limits
• Zoom in on or out of the time axis
• Show or hide alarms information
• Show or hide cursors
The cursor value for display data shows the minimum and maximum values.
TI001
13.07 / 13.15
TI001
13.07
Minimum value Maximum value
Instantaneous value
Event data
Display data
• Change the waveform line thickness
3.1 Using a Web Browser to Change the GX/GP Settings, Monitor Data, and Control the GX/GP (Web server function)