Dimension r charts for subgroups greater than one, 4 lcd scr eens and menus – HEIDENHAIN ND 2100G User Manual
Page 33
ND 2100G GAGE-CHEK
33
1
.4 LCD scr
eens and menus
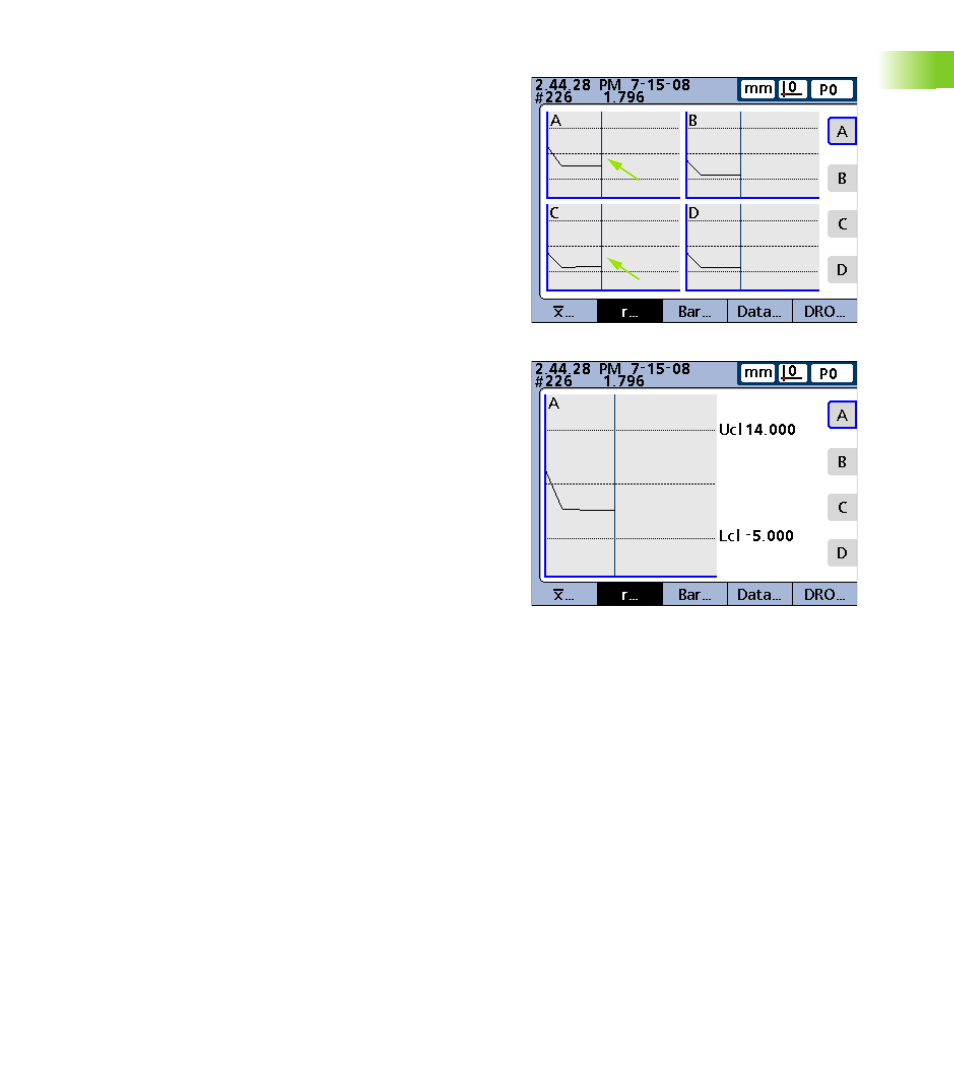
Dimension r charts for subgroups greater than one
For SPC subgroups greater than 1, the dimension r screen is displayed
in place of the Histogram screen discussed earlier. The dimension r
screen graphs the range ( r ) of each subgroup for up to 16 dimensions.
The range is not recalculated for each measurement, but is
recalculated each time a subgroup is completed. Refer to "SPC setup
screen" on page 91.
Use the arrow cursor keys to scroll the graphs when more data is
stored than will fit on the screen.
Individual subgroups are selected by a vertical line on the graph. Move
the vertical line left and right through the stored data using the arrow
cursor keys. The time and date when the selected subgroup data was
stored are shown in the upper left corner of the screen. The ID number
of the subgroup and the value of the data for the dimension are also
shown in the upper left corner. Displays of single dimensions also
show the range control limits.
r charts for subgroups greater than one.