Figure 4-41: alpa error graph example, Advanced monitoring v4.0.x (optional software), Advanced monitoring v4.0.x (optional software) –52 – HP StorageWorks 2.32 SAN Switch User Manual
Page 208: Alpa error graph example –52, Figure 4–41
Switch View
4–52
Web Tools Version 3.0.x/4.0.x User Guide
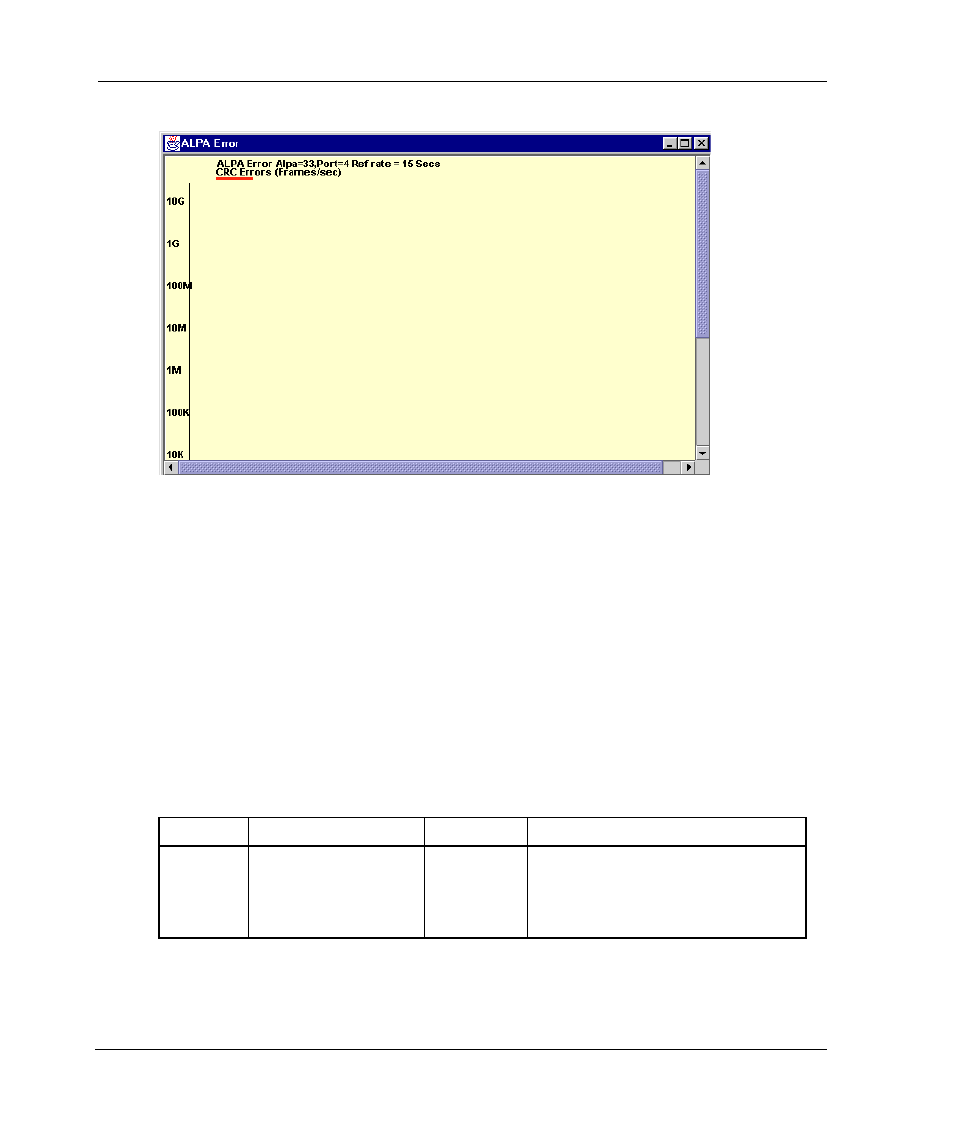
Figure 4–41: ALPA Error graph example
Advanced Monitoring V4.0.x (Optional Software)
Advanced Monitoring is optional licensed software. The Advanced Monitoring
sub-menu allows you to create graphs that monitor switch and port functionality such
as traffic and performance that is device-specific.
For information specific to Advanced Monitoring V3.0.x, see “Advanced Monitoring
V3.0.x (Optional Software)” on page 4–44.
Table 4–13 describes the types of graphs that are available through the Advanced
Monitoring menu.
Table 4–13: 4.0.x Graphs Displayed on an Advanced Monitoring
Canvas
Scope
Graph Name
Type
Description
Switch
SID/DID
Performance Graph
Line
This graph charts the traffic
between a SID and a DID pair on
the switch being managed. See
Figure 4–42.
- StorageWorks MSL6000 Tape Library (61 pages)
- Лент-е накопители HP StoreEver DAT (64 pages)
- Лент-е накопители HP StoreEver DAT (50 pages)
- StoreEver Ultrium Tape Drives (61 pages)
- StoreEver TapeAssure Software (40 pages)
- StoreEver Ultrium Tape Drives (75 pages)
- StoreEver Ultrium Tape Drives (60 pages)
- Linear Tape File System Software (28 pages)
- Linear Tape File System Software (25 pages)
- StoreEver Ultrium Tape Drives (78 pages)
- StoreEver Ultrium Tape Drives (76 pages)
- Linear Tape File System Software (20 pages)
- 2600fx Optical Disk Drive (65 pages)
- Ленточный автозагрузчик HP StorageWorks DAT 72x10 (58 pages)
- StorageWorks 1500cs Modular Smart Array (52 pages)
- StorageWorks 1500cs Modular Smart Array (71 pages)
- 2000fc Modular Smart Array (150 pages)
- StorageWorks 1000 Modular Smart Array (72 pages)
- StorageWorks 1000 Modular Smart Array (81 pages)
- StorageWorks 1500cs Modular Smart Array (48 pages)
- Servidor de almacenamiento HP ProLiant DL585 G2 (152 pages)
- Sistemas de almacenamiento de red HP StorageWorks X3000 (152 pages)
- Software de HP StoreVirtual VSA (127 pages)
- Software de HP StoreVirtual VSA (85 pages)
- X500 Data Vault (331 pages)
- StorageWorks 1000i Virtual Library System (122 pages)
- StorageWorks XP Remote Web Console Software (20 pages)
- 200 Storage Virtualization System (176 pages)
- XP Array Manager Software (101 pages)
- StorageWorks MSA 2.8 SAN Switch (307 pages)
- StorageWorks MSA 2.8 SAN Switch (22 pages)
- StorageWorks MSA 2.8 SAN Switch (104 pages)
- StorageWorks MSA 2.8 SAN Switch (270 pages)
- StorageWorks All-in-One SB600c Storage Blade (72 pages)
- StorageWorks All-in-One SB600c Storage Blade (80 pages)
- StorageWorks All-in-One SB600c Storage Blade (78 pages)
- StorageWorks All-in-One SB600c Storage Blade (60 pages)
- ProLiant DL585 G2 Storage-Server (150 pages)
- Data Protector Express Basic-Software (83 pages)
- Data Protector Express Basic-Software (93 pages)
- ProLiant DL185 G5 Storage Server (174 pages)
- ProLiant High Availability Storage Server (72 pages)
- 2000I G2-Modular-Smart-Array (48 pages)
- P2000 G3 MSA Array Systems (58 pages)
- StorageWorks 2000fc G2 Modular Smart Array (76 pages)