Table 4-1: switch events view fields, Fabric watch view v3.0.x (optional software), Accessing fabric watch view – HP StorageWorks 2.32 SAN Switch User Manual
Page 164: Fabric watch view v3.0.x (optional software) –8, Accessing fabric watch view –8, Switch events view fields –8
Switch View
4–8
Web Tools Version 3.0.x/4.0.x User Guide
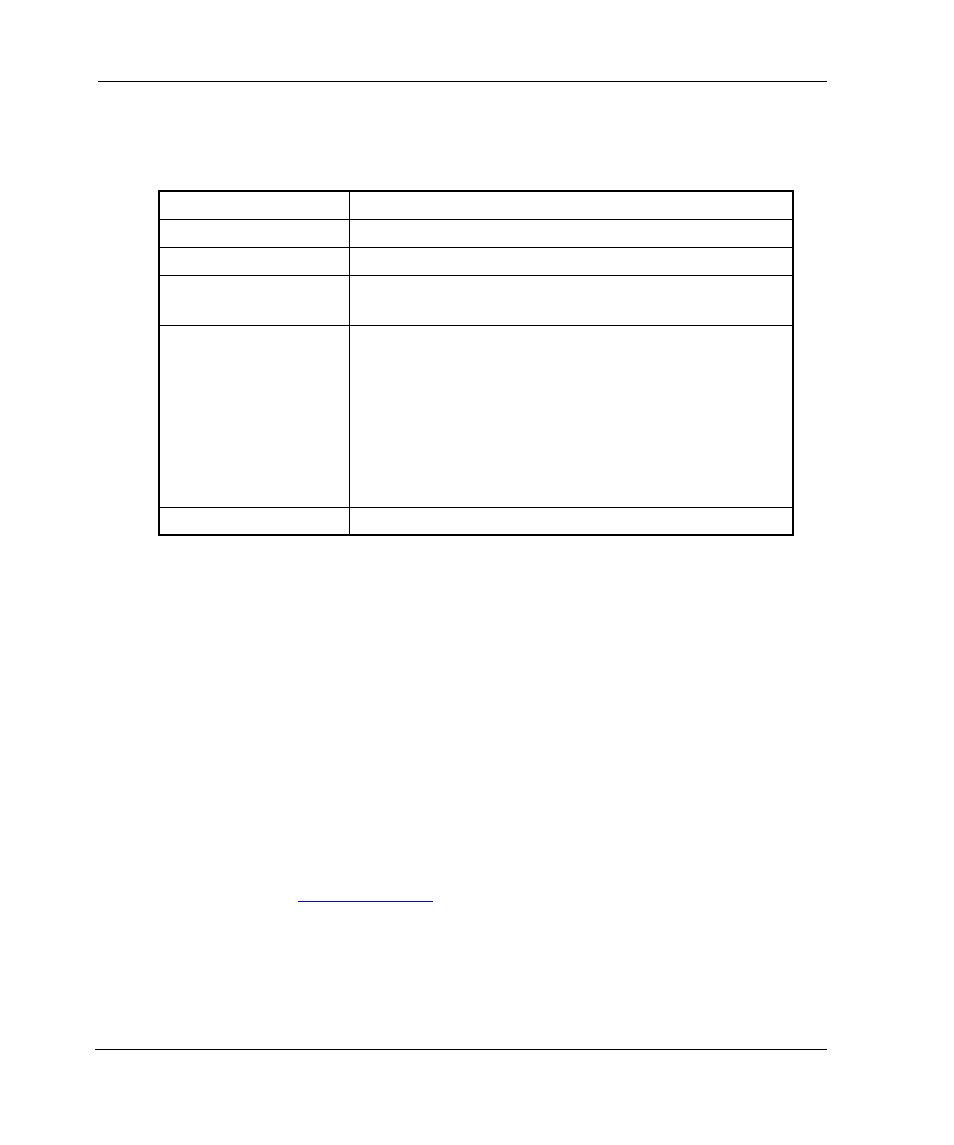
Table 4–1 provides a description of the columns in Switch Events View.
Fabric Watch View V3.0.x (Optional Software)
You can use Fabric Watch View to monitor fabric elements for potential problem
conditions. This feature requires an active Fabric Watch license. For detailed
information about Fabric Watch, refer to the HP StorageWorks Fabric Watch Version
3.0.x/4.0.x User Guide.
For information regarding Fabric Watch 4.0.x in Web Tools, see “Fabric Watch View
V4.0.x (Optional Software)” on page 4–19.
Accessing Fabric Watch View
1. Launch the web browser.
2. Enter the switch name or IP address in the Location/Address field and click Enter.
For example:
http://switch name
Web Tools launches, displaying Fabric View.
3. Click the Switch icon.
The Switch View displays.
Table 4–1: Switch Events View Fields
Switch
Displays the name of switch.
Number
Displays the event number.
Time
Displays the time of event.
Count
Displays the number of back-to-back occurrences of
same event.
Level
Displays the severity level of event:
0 panic (switch reboots)
1 critical
2 error
3 warning
4 information
5 debug
Message
Displays the description of event.