Ports snapshot error graph, Figure 4-34: ports snapshot error graph, Advanced monitoring v3.0.x (optional software) – HP StorageWorks 2.32 SAN Switch User Manual
Page 200: Ports snapshot error graph –44, Advanced monitoring v3.0.x (optional software) –44, Ports snapshot, X graphs displayed on an advanced canvas –44, D table 4–12 d, Figure 4–34
Switch View
4–44
Web Tools Version 3.0.x/4.0.x User Guide
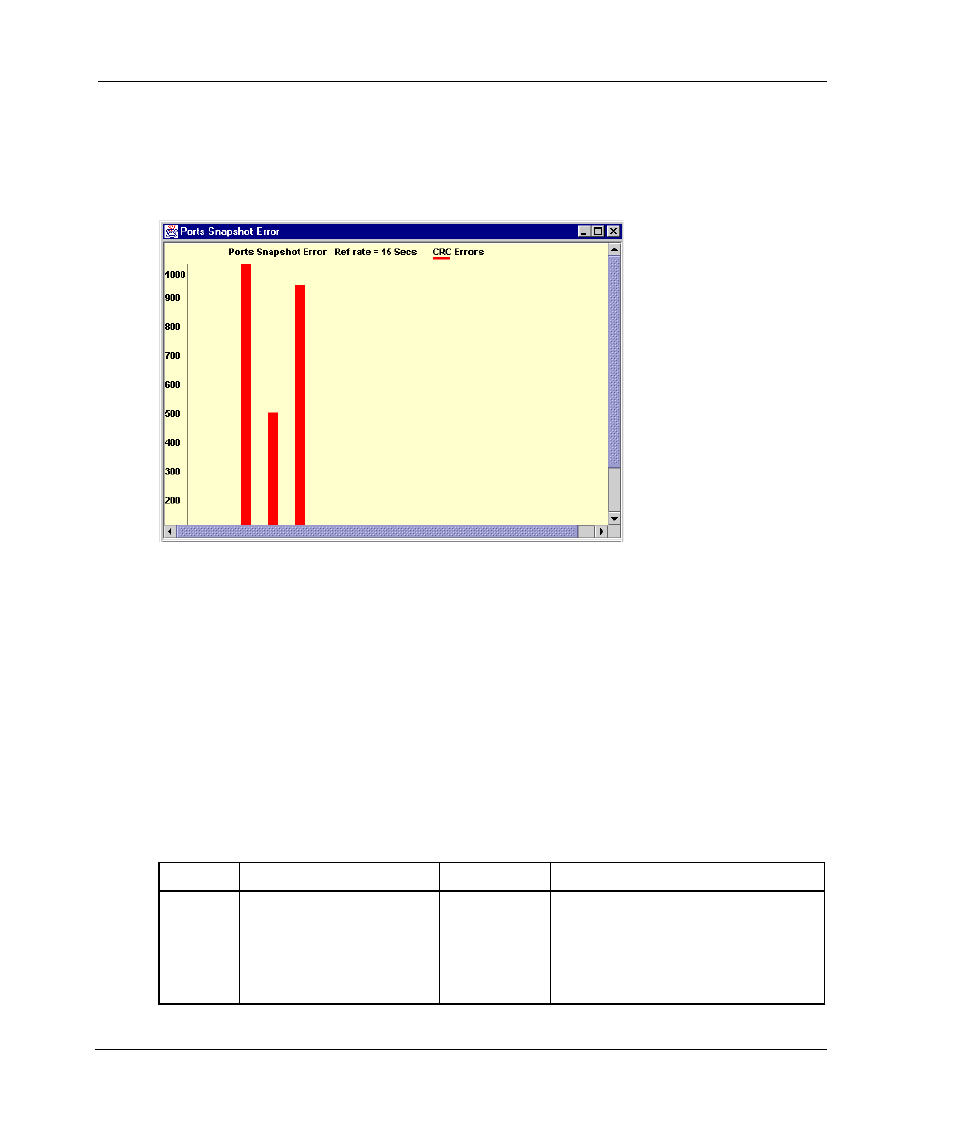
Ports Snapshot Error Graph
An example of a Ports Snapshot Error Graph, displaying the CRC error count between
sampling periods, is shown in Figure 4–34.
Figure 4–34: Ports Snapshot Error graph
Advanced Monitoring V3.0.x (Optional Software)
The Advanced Monitoring is an optionally licensed software. The Advanced
Monitoring sub-menu allows you to create graphs that monitor switch and port
functionality, such as traffic and performance, that is device-specific.
NOTE: For information specific to Advanced Monitoring for 4.0.x, see “Advanced Monitoring
V4.0.x (Optional Software)” on page 4–52.
Table 4–12 describes the types of graphs that are available through the Advanced
Monitoring menu.
Table 4–12: 3.0.x Graphs Displayed on an Advanced Canvas
Scope
Graph Name
Type
Description
Switch
SID/DID Performance
Graph
Line
This graph charts the traffic
between a SID (or WWN) and a
DID (or WWN) pair on the switch
being managed. See
Figure 4–35.