1 latest analysis results, Latest analysis results -51, Ldisplay contents – Yokogawa GC8000 Process Gas Chromatograph User Manual
Page 98: Ldisplaying the latest analysis results
<4. Display and Operations while Connected to GC8000>
4-51
IM 11B06C01-01E
4.5.1
Latest Analysis Results
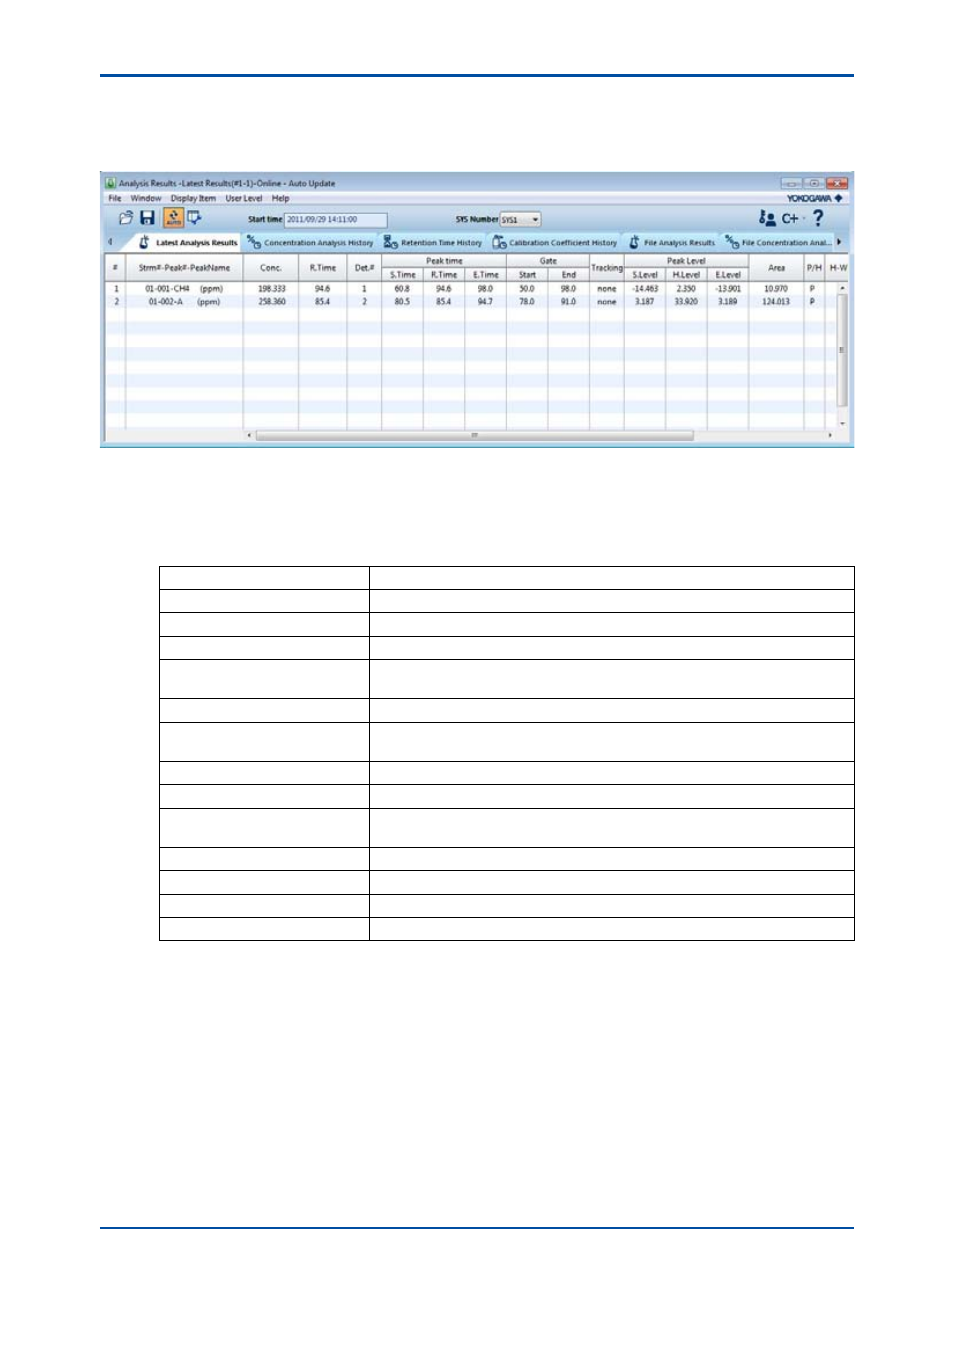
When the Latest Analysis Results window starts up, the latest analysis results are displayed for
each system. The head system number belonging to GCM is displayed for the system.
Figure 4.60
Analysis Results window
l
Display contents
The following list the display contents for each item.
Item
Description
Concentration
Indicates concentration for each peak.
Retention Time
Indicates retention time (second) for each peak.
Det.#
Indicates detector number (1 to 6) for each peak.
Peak
start/Retention/end
Indicates peak processing start time/retention time/end time (second) for
each peak.
Gate start/end
Indicates gate start time/end time (second) for each peak.
Tracking
Indicates the peak pursuing status for each peak as “standard”, “pursuit”, or
“none”.
Peak Level start/height/end
Indicates the peak start level/height level/end level (mV) for each peak.
Area
Indicates the integral value of the peak level (mV second) for each peak.
Shape
Indicates the peak data processing status for each peak. It displays “P” for
tangent correction resetting or “H” for the perpendicular method.
Half-value Width
Indicates a half-value width (second) for each peak.
Tailing Coefficient
Indicates a tailing constant for each peak.
Variation Coefficient
Indicates a concentration variation coefficient for each peak.
Method
Indicates a concentration computation method for each peak.
l
Displaying the Latest Analysis Results
1) Select Latest Analysis Results in the Window menu, or the Latest Analysis Results tab to
display the Latest Analysis window.
2) Select SYS Number Select in the Display Item menu, or the system number of the analysis
result you want to display from the system number select combo box on the toolbar.
5th Edition : Nov. 16, 2011-00