5 plotting history data on graph, Plotting history data on graph -58 – Yokogawa GC8000 Process Gas Chromatograph User Manual
Page 105
<4. Display and Operations while Connected to GC8000>
4-58
IM 11B06C01-01E
4.5.5
Plotting History Data on Graph
The Concentration Analysis History, Retention Time History, and Calibration Coefficient History
data can be displayed on a graph.
l
Drawing a graph
1) From Concentration Analysis History, Retention Time History, and Calibration Coefficient
History, select data you want to display on a graph and display it in either of the windows.
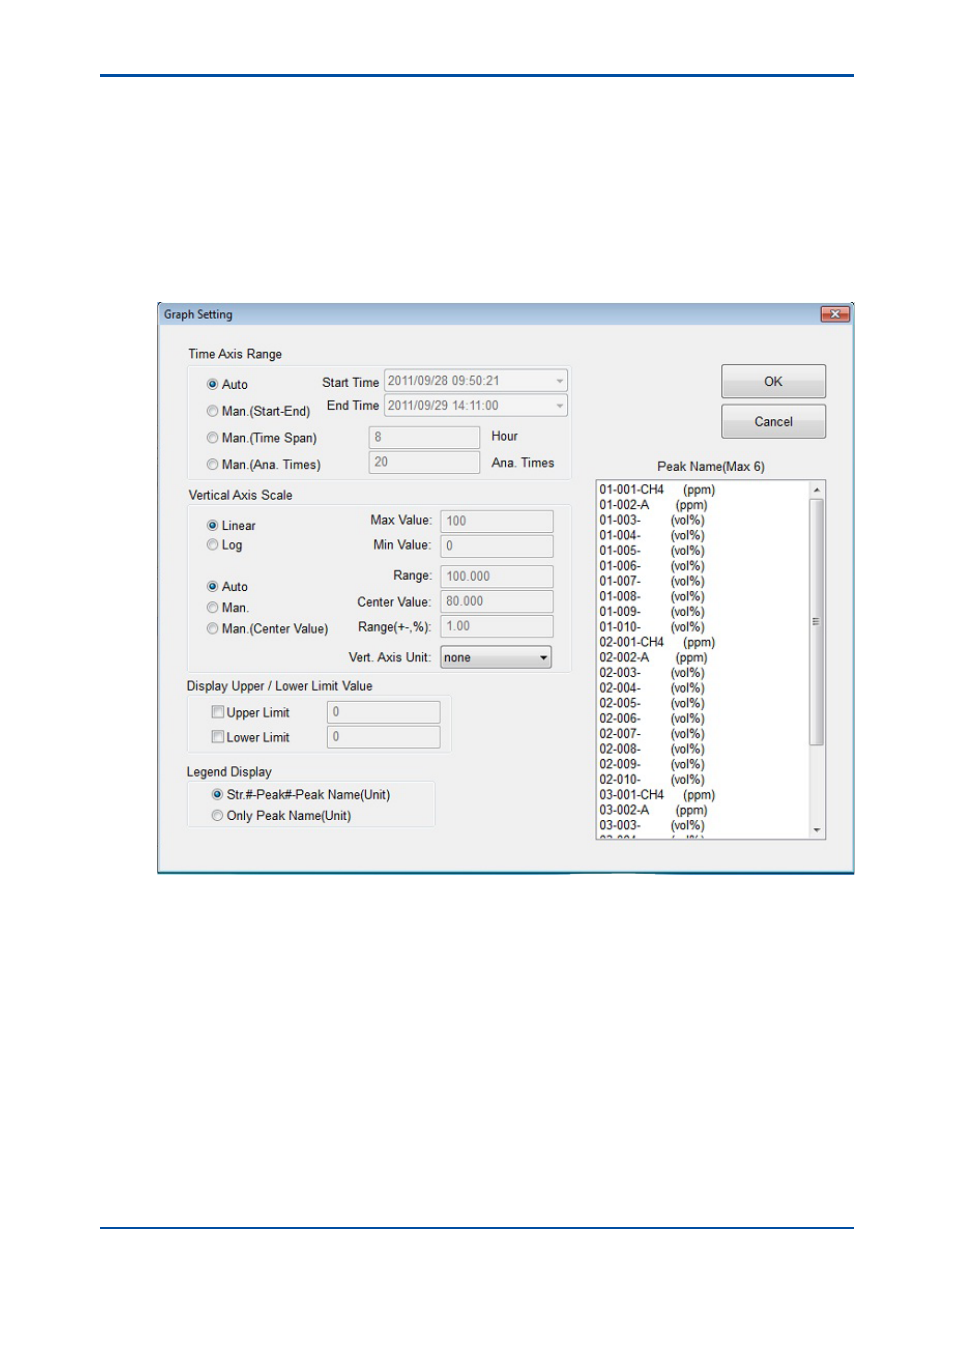
2) Select Graph A, Graph B, or Graph C in the Graph menu, or Graph A, Graph B, or Graph C
on the toolbar to open the Graph Setting window.
Figure 4.72
Graph Setting window
3) From the setting window, select peak names for which you want to create a graph. Up to six
peak names can be selected at a time.
4) Set up the time axis range. The following shows the setup conditions:
• If “Auto Setup” is selected, the graph displays results for 5,000 analyses tracing back from
the latest. Each time the latest analysis result is obtained, the graph window is automatically
updated.
• If “Manual Setup” is selected and when “From the latest analysis time” is selected for the
end time, the graph window is automatically updated each time the latest analysis result is
obtained.
• If “Manual Setup” is selected, the setup range of tracing back is 1 to 72 hours and 1 to 5,000
analyses.
5th Edition : Nov. 16, 2011-00