See also, Lwindow elements, Lcontents of display – Yokogawa GC8000 Process Gas Chromatograph User Manual
Page 117
<5. Display and Operations while Connected to GC1000 Mark II>
5-7
IM 11B06C01-01E
n
Chromatogram Display Section
The chromatogram display section is a part of the Analyzer Operation window that displays the
latest chromatogram for every analysis cycle.
It displays one chromatogram if there is one detector or two chromatograms if there are two
detectors. It also displays the temperature pattern of the programmed temperature oven or
isothermal oven. In addition, this section displays one pressure graph for one EPC or two
pressure graphs for two EPCs.
Because the current elapsed time is indicated by dotted lines, which timing and where the current
location is in the analysis cycle is recognizable at a glance.
SEE ALSO
For the Chromatogram Display window, see Chapter 5.
l
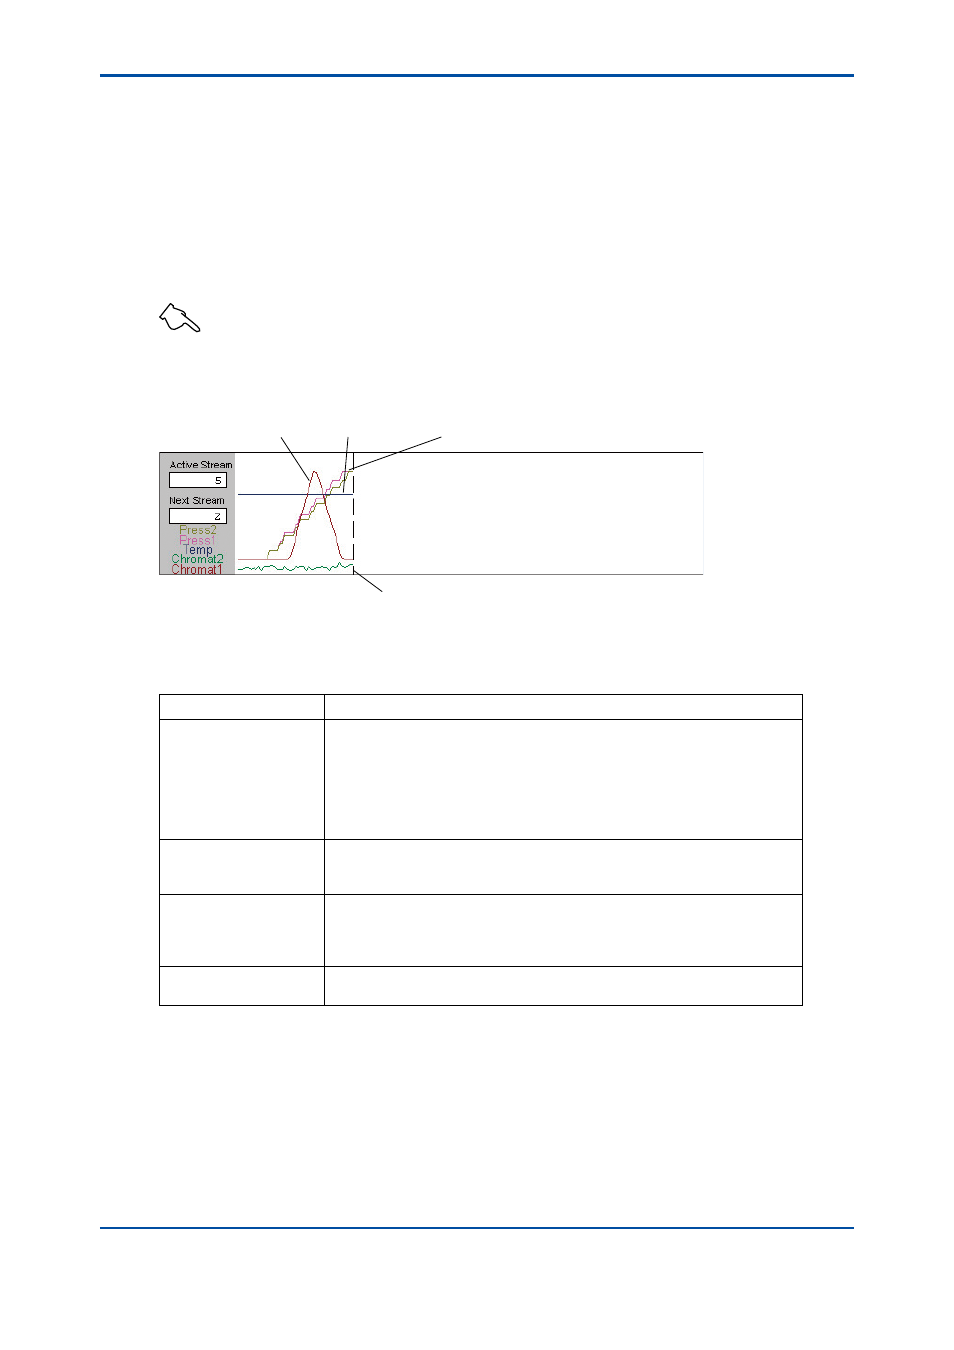
Window elements
F5-2-4.ai
Chromatogram
Temperature
Pressure
Indicates the current elapsed time in dotted lines.
l
Contents of display
The scales are displayed as follows:
Scales/Item
Description
Horizontal Scale
The analysis cycle set for each stream is regarded as a full scale. In Manual
mode, when you issue the measurement start command from the window,
chromatogram display starts and continues until the measurement end
command is issued.
During this period, each time a chromatogram exceeds the horizontal axis,
the time scale is automatically extended and adjusted so that the entire
chromatogram is displayed.
Vertical Scale
The vertical scale is displayed in auto scale and is automatically adjusted so
that data deflection up to that time is about 80% of the range. Auto scaling is
independently achieved for both chromatograms and temperature.
Stream under
Measurement
Indicates the number of the stream currently being measured.
In conditions where sample replacement is possible (calibration
(verification) method can be done in manual only), “Replacement available”
is displayed.
Stream to be Measured
Next
Indicates the number of the stream scheduled to be measured next.
If the stream concerned is under preparation, a “P” indication is added.
n
Timing Display Section
The timing display section is the part of the Analyzer Operation window that displays the ON/OFF
status of the valves for each analysis cycle and the ON/OFF timing of the gate(s).
The current elapsed time is indicated by dotted lines; which timing and where the current location
is in the analysis cycle is recognizable at a glance.
If there are two detectors, the gate ON/OFF timing is displayed on a detector basis.
5th Edition : Nov. 16, 2011-00