See also, Lcontents of display, Lwindow elements – Yokogawa GC8000 Process Gas Chromatograph User Manual
Page 119
<5. Display and Operations while Connected to GC1000 Mark II>
5-9
IM 11B06C01-01E
l
Contents of display
The following table lists the contents of the display:
Display Item
Description
Stream Valve
Indicates the stream-switching valve status by number. If all the valves are
OFF, this section is grayed out.
V1 to 8
Indicates the ON/OFF status of valves 1 to 8.
Det1/Det2
Indicates the ON/OFF status of the detectors. When the status is in Manual
mode, moving the mouse cursor over this section and clicking the right
button causes the Detector Signal Display window to appear.
HEAT/PRESS/AI
Displays one of the following: temperature controller status, EPC status, or
AI value. Which value to display can be selected using the List Button box.
When the status is in Manual mode and either HEAT or PRESS is
displayed, moving the mouse cursor over this section and clicking the left
button causes the Temperature Control Unit Operation window or Pressure
window to appear respectively.
SEE ALSO
For detector signals and temperature controller status display, see section 3.3.
n
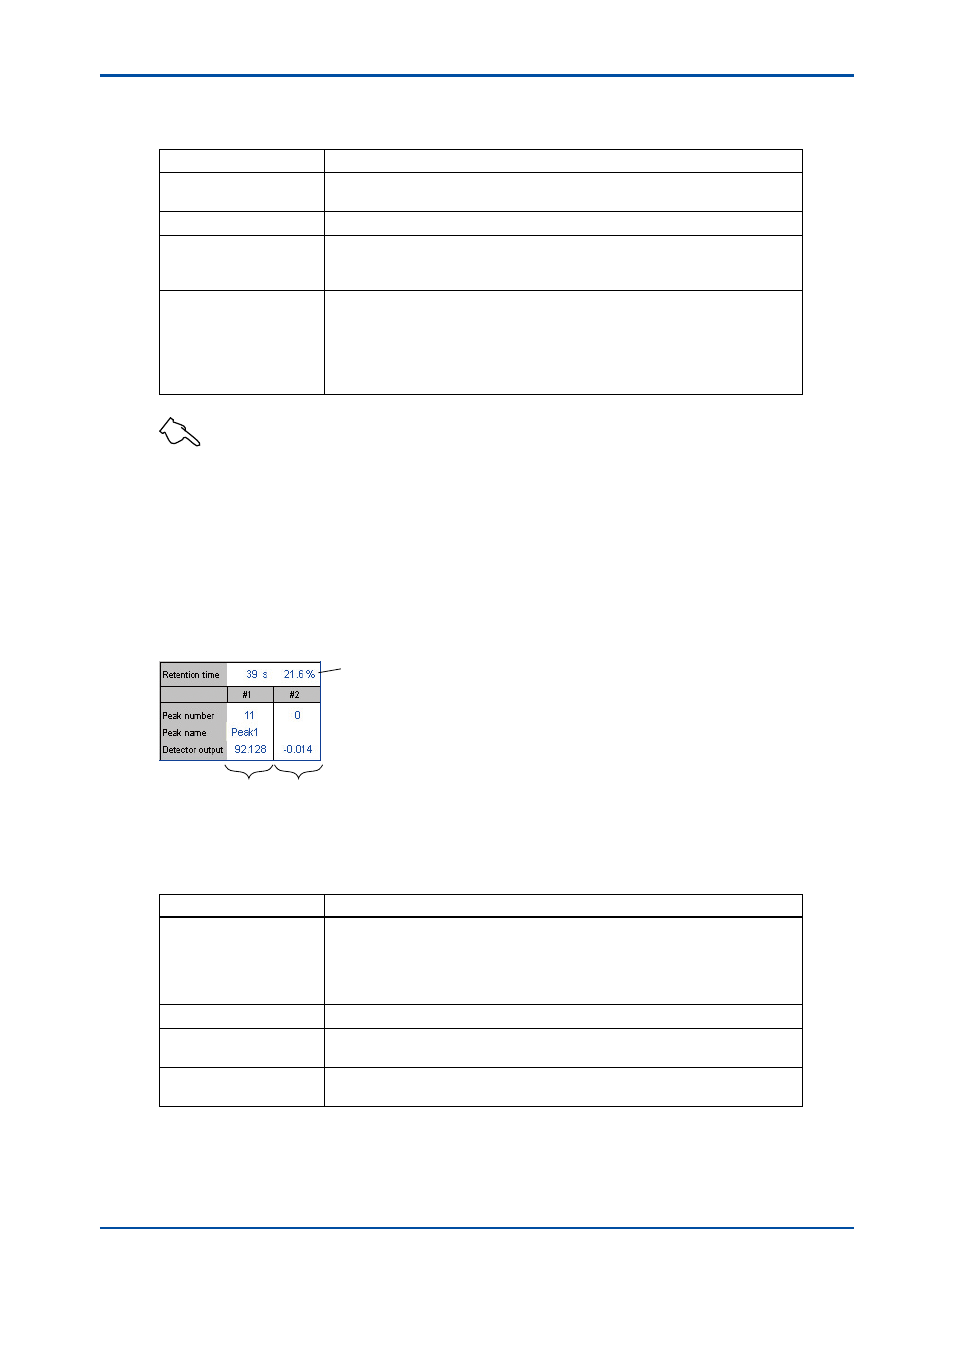
Data Display Section
The data display section is the part of the Analyzer Operation window that displays the elapsed
time, peak number, peak name, and detector signal. The data updating cycle is 1 second. If there
are two detectors, data is displayed on a detector basis.
l
Window elements
F5-2-7.ai
Common data section
Detector 1
data
Detector 2
data
l
Contents of display
The following table lists the contents of the display:
Display Item
Description
Elapsed Time
Indicates the time (second) that has elapsed from the start of analysis.
This section also shows the ratio of the elapsed time to the analysis cycle
in %. In the Manual mode, because the time axis is automatically adjusted,
the ratio of the elapsed time to the full scale is indicated in %. In cases of
being prepared, this part indicates the elapsed time in minus value.
Peak Number
Indicates the number of the peak currently being detected.
Peak Name
Displays the name of the peak currently being detected. Moving the mouse
cursor over the peak name causes the peak name to appear as a tool hint.
Detector Output
Displays a detector signal in mV. The chromatogram displayed in the
chromatogram display section represents the pattern of this signal
5th Edition : Nov. 16, 2011-00