Caution, Lwindow configuration, Ldisplay contents – Yokogawa GC8000 Process Gas Chromatograph User Manual
Page 153
<5. Display and Operations while Connected to GC1000 Mark II>
5-43
IM 11B06C01-01E
CAUTION
If peak configuration or the total number of peak number assignments is modified while the
analysis results window is activated, re-establish individual connection with the analyzer to re-
acquire the database from the analyzer. Continuing to perform operations without re-establishing
individual connection with the analyzer may cause added or modified data to be improperly
displayed in the window.
• Data in the window can be converted to a graph using the Create command in the Graph
menu. (Only calibration coefficient data can be turned into a graph; no standard area data
can be made into a graph.)
l
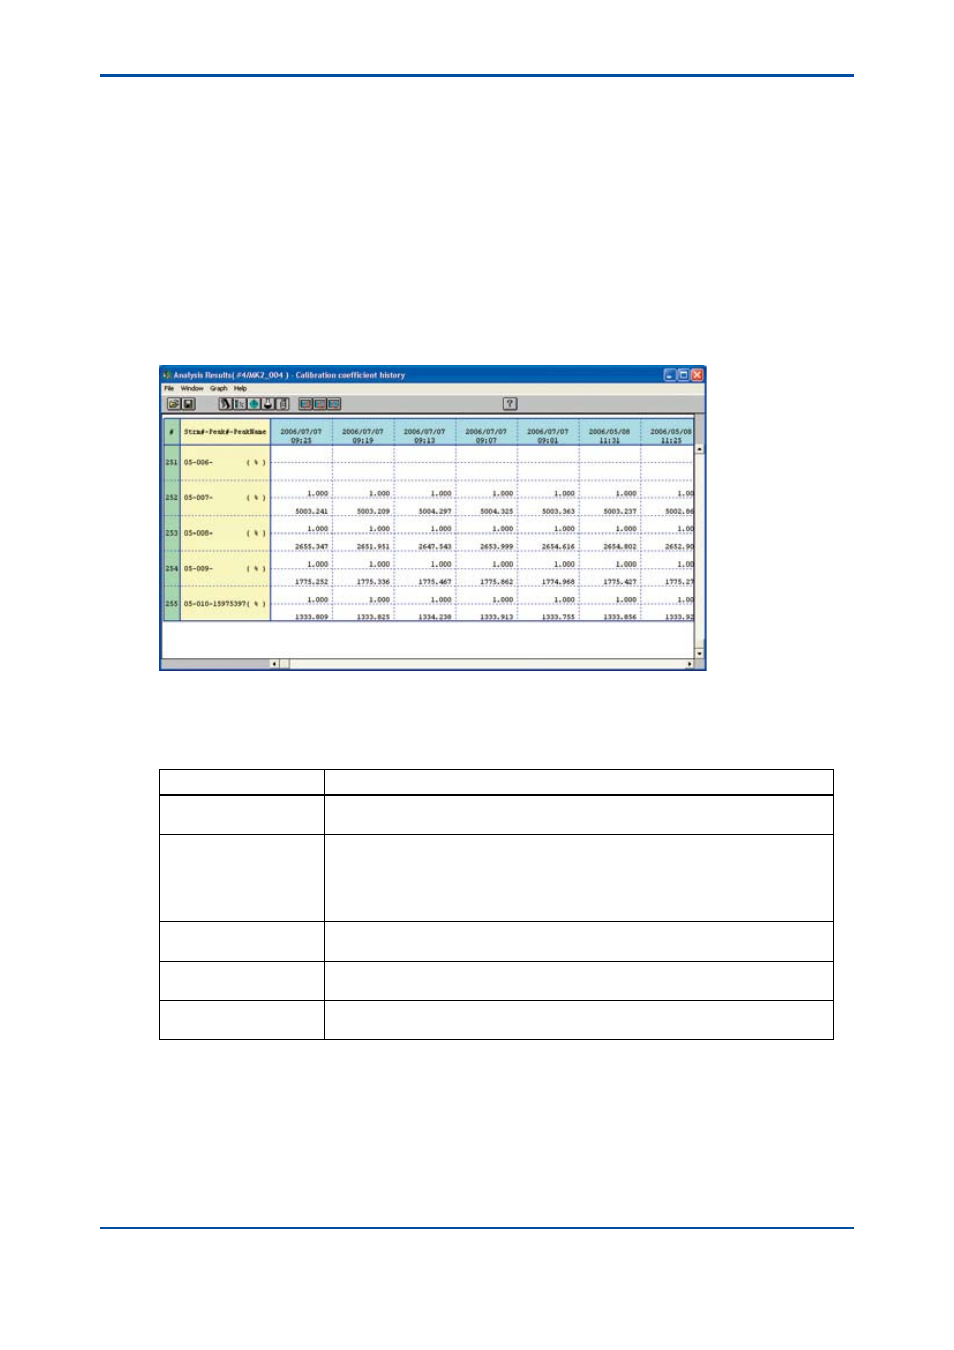
Window configuration
The following shows the configuration of the Calibration Coefficient History window.
F5-4-7.ai
l
Display contents
The following lists the display contents for each item.
Item
Display Contents
#
Indicates the absolute numbers of peaks (serial numbers for all peaks of all
tasks): 1 to 255.
Stream # - Peak #
- Peak Name
Indicates all peaks that have been assigned numbers in the analyzer, in an
ascending order of stream numbers and of peak numbers (order of assignment).
A stream number, peak number, and peak name are connected and indicated in
this order using “-”, and the concentration unit (%, ppm, or no unit) of that peak is
indicated in parentheses at the end.
Date/Time
Indicates the date (year/month/day) and time (hour:minute) at which analysis
was started, for each analysis cycle (250 times maximum).
Calibration Coefficient
Indicates the calibration coefficient for each peak in the upper part of the Data
Display area.
Standard Area
Indicates the standard area for each peak in the lower part of the Data Display
area.
5th Edition : Nov. 16, 2011-00