6 plotting history data on a graph, Plotting history data on a graph -51, Caution – Yokogawa GC8000 Process Gas Chromatograph User Manual
Page 161: Ndrawing a graph
<5. Display and Operations while Connected to GC1000 Mark II>
5-51
IM 11B06C01-01E
5.4.6
Plotting History Data on a Graph
Using the data of a history window (Concentration Analysis History, Retention Time History,
Calibration coefficient History File Concentration Analysis History, File Retention Time Analysis
History or File Calibration coefficient History), a graph can be created. Unnecessary graphs can
be closed.
CAUTION
Data from windows other than the history windows (Latest Analysis Results, Laboratory Analysis
Results, File Analysis Results, and File Laboratory Analysis Results) cannot be used to create
graphs.
n
Drawing a Graph
l
Operation procedure
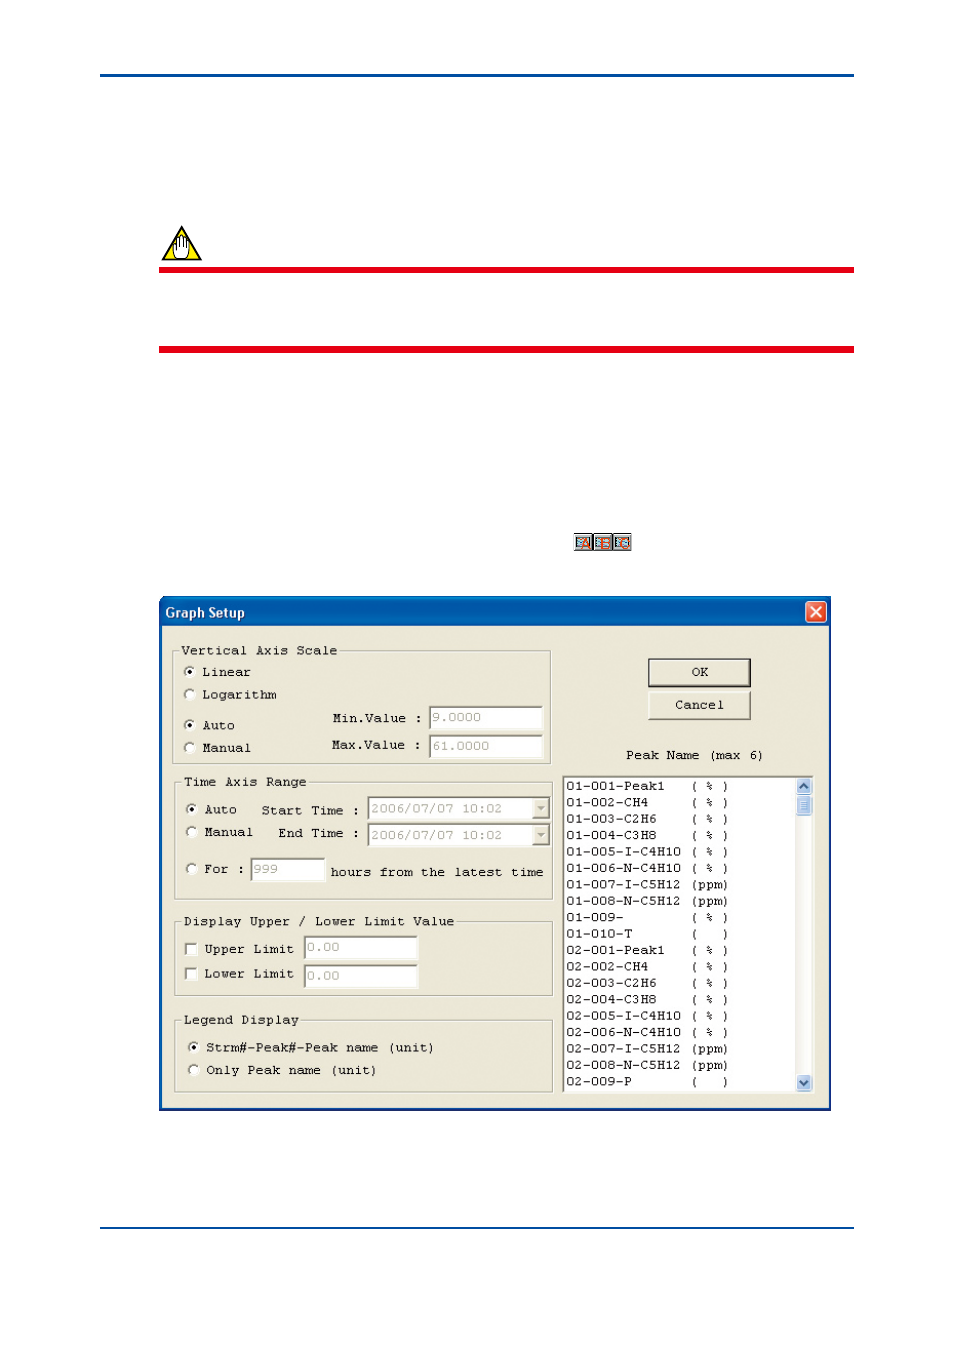
(1) With a history window (one of the noted six windows) displayed, click the Create command
in the Graph menu.
• This operation can also be conducted by clicking the
button on the toolbar.
A dialog box for setting up a graph appears.
F5-4-16.ai
5th Edition : Nov. 16, 2011-00